. 2010 Sep 1;21(17):3080-92.
doi: 10.1091/mbc.E10-01-0006. Epub 2010 Jun 29.

The HOG pathway dictates the short-term translational response after hyperosmotic shock

Affiliations

The HOG pathway dictates the short-term translational response after hyperosmotic shock

Jonas Warringer et al. Mol Biol Cell. .

Abstract

Cellular responses to environmental changes occur on different levels. We investigated the translational response of yeast cells after mild hyperosmotic shock by isolating mRNA associated with multiple ribosomes (polysomes) followed by array analysis. Globally, recruitment of preexisting mRNAs to ribosomes (translational response) is faster than the transcriptional response. Specific functional groups of mRNAs are recruited to ribosomes without any corresponding increase in total mRNA. Among mRNAs under strong translational up-regulation upon shock, transcripts encoding membrane-bound proteins including hexose transporters were enriched. Similarly, numerous mRNAs encoding cytoplasmic ribosomal proteins run counter to the overall trend of down-regulation and are instead translationally mobilized late in the response. Surprisingly, certain transcriptionally induced mRNAs were excluded from ribosomal association after shock. Importantly, we verify, using constructs with intact 5' and 3' untranslated regions, that the observed changes in polysomal mRNA are reflected in protein levels, including cases with only translational up-regulation. Interestingly, the translational regulation of the most highly osmostress-regulated mRNAs was more strongly dependent on the stress-activated protein kinases Hog1 and Rck2 than the transcriptional regulation. Our results show the importance of translational control for fine tuning of the adaptive responses.


Figures

Figure 1.
Figure 1.
Changes in translational activity during adaptation to mild osmostress. (A and B) The fraction of mRNA bound ribosomes (polysomes) decreases temporarily after exposure to 0.4 M NaCl but rebounds to preshock levels after 30 min. (A) Ribosomal light subunits (40S), heavy subunits (60S), monosomes (80S), and polysomes (>80S) from samples collected before or after salt shock were separated using a linear 10–50% sucrose density gradient, and the relative amount of rRNA in each fraction was measured online by UV spectrometry after gradient elution. Representative absorbance curves are displayed. (B) Fraction of rRNA located in 40S, 60S, monosomes, and polysomes at different time points after a 0.4 M NaCl shock (n = 3–5) calculated from profiles as shown in A. (C–E) Formation of translating ribosomes is hampered in hog1Δ and rck2Δ mutants, albeit in different ways. (C) 40S, 60S, monosomes (80S), and polysomes from samples collected before or 6 min after salt shock in wt, hog1Δ, and rck2Δ were separated using a linear 10–50% sucrose density gradient. The relative amount of rRNA in each fraction was measured by spectrometry after gradient elution; representative absorbance curves are displayed. (D) Fraction of rRNA found in polysomes before and after salt exposure in wt and hog1Δ cells (n = 6–10), calculated from online profiles as shown in C. No or delayed recovery is observed in hog1Δ cells. (E) Relative proportion 60S/80S rRNA in wt and rck2Δ cells before and after salt exposure in wt and hog1Δ (n = 6–10) calculated from online profiles as shown in C. Assembly of monosomes is partially impeded in rck2Δ mutants.
Figure 2.
Figure 2.
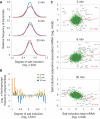
Translational regulation is faster than transcriptional regulation during adaptation to osmostress. (A and B) Regulation of the polysome association of mRNAs precedes changes in total mRNA. (A) The regulation of each of ∼5500 transcript after 2, 6, and 30 min of exposure to 0.4 M NaCl on the levels of total mRNA, and polysome association was determined by mRNA microarrays. The number of regulated transcripts at different levels of salt induction/repression (grouped in 22 bins) was plotted in frequency histograms. Red line, polysome associated mRNA; blue line, total mRNA. (B) At each level of salt induction and salt repression, the number of regulated mRNAs in the polysome-bound pool and in the total mRNA pool was compared, and log2 of the ratio between them was plotted (log2 [polysome/total]). Zero is the number of salt regulated transcripts at the indicated level of regulation is the same in the polysome-bound pool and in the total mRNA pool. Frequency data were derived from A, with similar bins. (C) Scatter plots portraying the correlation between polysomal association regulation and total mRNA regulation for all individual ∼5500 transcripts at 2, 6, and 30 min after exposure to 0.4 M NaCl. Red line, the overall linear correlation; linear regression coefficients (r2) are indicated.
Figure 3.
Figure 3.
Translational regulation of translation-activated and translation-deactivated osmostress genes is Hog1 and Rck2 dependent. (A) The 66 core transcriptional NaCl responders identified by meta-analysis of published salt induction data sets (Molin et al., 2009; see Materials and Methods) are unequally mobilized by the translational apparatus. Average induction of the core transcriptional set responders considering the total and polysomal mRNA levels. Error bars, SE. (B) A subset of the core salt-induced transcripts is selectively rejected by the translational apparatus after NaCl shock. The core transcriptional salt responders were hierarchically clustered (uncentered Pearson similarity metric, average linkage mapping) on the basis of total mRNA and polysomally associated mRNA salt induction (log2 n-fold induction) in wt, hog1Δ, and rck2Δ cells. A subcluster of genes that are selectively rejected by the translational apparatus is indicated with color (green lines). (C) Many translationally mobilized transcripts are not transcriptionally induced during salt stress (blue lines). Average (n = 3) polysomal and transcriptional induction of the top 200 polysomally most induced genes during salt stress.
Figure 4.
Figure 4.
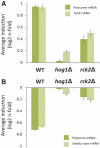
Stress mRNA regulation dependence on Hog1 and Rck2 is stronger on the translational level. (A) Average induction at 6 min after NaCl exposure of the 200 most salt-induced genes (in wt), considering either polysomal or total mRNA levels. Induction is strongly reduced in hog1Δ mutants and moderately reduced in rck2Δ mutants, and particularly for hog1Δ mutants, reduction is stronger on the level of polysomal mRNA. Error bars, SE. (B) Average induction at 6 min after NaCl exposure of the 200 most salt repressed genes (in the wt), considering either polysomal or total mRNA levels. Repression is strongly impeded in both hog1Δ and rck2Δ mutants, and particularly for hog1Δ cells, the effect is stronger on the level of polysomal mRNA. Error bars, SE.
Figure 5.
Figure 5.
Divergent translational and transcriptional regulation for cRPs and hexose during adaptation to high NaCl. (A–D) A subset of genes are differently regulated on the level of total mRNA and on the level of polysome association. (A) To identify major functional differences between polysomal and the total mRNA salt regulation, the overrepresentation of known cellular functions among the top 200 most salt-induced (left panel) genes in each of wt (2, 6, and 30 min), hog1Δ (6 min), and rck2Δ cells (6 min). Colors indicate log(2) fold enrichment in each class for functional categories that deviated significantly from the chance expectation at p < 10−4 (Fisher's exact test) in at least one class. Yellow, functional overrepresentation; blue, functional underrepresentation. Functional annotations were taken from the MIPS S. cerevisiae genome database, including only categories with at least 15 members present in the screen. All enriched categories were hierarchically clustered according to degree of enrichment in each class using an uncentered Pearson similarity metric and average linkage mapping. Blue text, counterdirectional functional enrichments for total and polysome-associated mRNA; red text, Hog1 dependent functional enrichments. (B and D) The difference in the degree of salt induction on the polysomal association level and the total mRNA level (log2 [polysome NaCl induction/total mRNA NaCl induction]) was calculated for each individual transcript. (B) All genes annotated as associated with ribosomes were hierarchically clustered (as above) according to the difference in degree of translational and transcriptional induction (log2 [polysome NaCl induction/total mRNA NaCl induction]). Red squares, higher translational than transcriptional induction and green squares, the converse. Major clustering groups and the relative proportions (absolute numbers within brackets) of gene products in each clustering group that are resident members of the mitochondrial ribosome, the cytoplasmic ribosome, or more loosely associated with the cytoplasmic ribosome are indicated with color. A subset of mRNAs encoding cRPs is more strongly induced on the translational level (red lines). (C) Membrane protein–encoding transcripts are more frequent among the polysome association salt-induced transcripts than among the total mRNA salt-induced transcripts. Degree of enrichment of membrane proteins (GO annotations) among the top 25, 50, 100, and 200 most salt-induced transcripts considering either polysomal association induced or total mRNA–induced transcripts in wt cells. Enrichments are significantly stronger on the level of polysomal association among the very highly salt-induced genes (Student's t test; **p < 0.01, ***p < 0.001). (D) All genes annotated (MIPS FunCat) as possessing sugar transport activity was hierarchically clustered (as above) according to the difference in degree of salt induction on the polysomal association level and the total mRNA level (log2 [polysome salt induction/total mRNA salt induction]). Major clustering groups are indicated with color. A subset of sugar transport genes with primarily low affinity hexose transport activity is more strongly salt-induced on the polysomal level (red lines).
Figure 6.
Figure 6.
Protein levels after shock parallel the levels of the corresponding polysomal mRNAs. (A–E) Left, Western blots of Myc-tagged proteins at the indicated number of min after shock with 0.4 M NaCl. Strains express the tagged proteins from constructs integrated at the native chromosomal site and preserving the original 5′- and 3′-UTRs (see Materials and Methods). Ponceau staining of total protein was used as a loading control. Right, changes in total and polysomal mRNA abundance (log2 values) for the cognate transcripts at three different time points after NaCl shock in array measurements. For Gdh3, Tpo4, and Hxt9 (A–C), a transient increase is seen in the polysomal, but not the total, mRNA pool. For Hsp31 and Ssa1 (D and E), total mRNA but not polysomal mRNA is increased.

Similar articles

Cited by

References

    1. Albertsen M., Bellahn I., Kramer R., Waffenschmidt S. Localization and function of the yeast multidrug transporter Tpo1p. J. Biol. Chem. 2003;278:12820–12825. - PubMed
    1. Alepuz P. M., de Nadal E., Zapater M., Ammerer G., Posas F. Osmostress-induced transcription by Hot1 depends on a Hog1-mediated recruitment of the RNA Pol II. EMBO J. 2003;22:2433–2442. - PMC - PubMed
    1. Alepuz P. M., Jovanovic A., Reiser V., Ammerer G. Stress-induced map kinase Hog1 is part of transcription activation complexes. Mol. Cell. 2001;7:767–777. - PubMed
    1. Asp E., Nilsson D., Sunnerhagen P. Fission yeast mitogen-activated protein kinase Sty1 interacts with translation factors. Eukaryot. Cell. 2008;7:328–338. - PMC - PubMed
    1. Asp E., Sunnerhagen P. Mkp1 and Mkp2, two MAPKAP-kinase homologues in Schizosaccharomyces pombe, interact with the MAP kinase Sty1. Mol. Genet. Genom. 2003;268:585–597. - PubMed

Publication types

MeSH terms

LinkOut - more resources