. 2010 Jun 29;3(128):ra50.
doi: 10.1126/scisignal.2000724.

Origins and diversification of a complex signal transduction system in prokaryotes

Affiliations

Origins and diversification of a complex signal transduction system in prokaryotes

Kristin Wuichet et al. Sci Signal. .

Abstract

The molecular machinery that controls chemotaxis in bacteria is substantially more complex than any other signal transduction system in prokaryotes, and its origins and variability among living species are unknown. We found that this multiprotein "chemotaxis system" is present in most prokaryotic species and evolved from simpler two-component regulatory systems that control prokaryotic transcription. We discovered, through genomic analysis, signaling systems intermediate between two-component systems and chemotaxis systems. Evolutionary genomics established central and auxiliary components of the chemotaxis system. While tracing its evolutionary history, we also developed a classification scheme that revealed more than a dozen distinct classes of chemotaxis systems, enabling future predictive modeling of chemotactic behavior in unstudied species.


Conflict of interest statement

Competing interests: The authors declare that they have no competing interests.

Figures

Fig. 1
Fig. 1
Summary of current knowledge of organization of the bacterial chemotaxis system. Components outlined in light gray and their interactions (gray lines) are not present in the model organism E. coli, but have been studied in other species (8, 13). A, CheA histidine kinase; W, CheW, and V, CheV scaffolding proteins; Y, CheY response regulator; R, CheR methyl-transferase; B, CheB methylesterase; Z, CheZ phosphatase; C, CheC phosphatase; X, CheX phosphatase; D, CheD deamidase.
Fig. 2
Fig. 2
Phyletic distribution of the chemotaxis system. Relationships between major prokaryotic phyla are shown as an unrooted maximum likelihood tree (Materials and Methods). Phyla containing representatives with chemotaxis system components are shown in red. The number of these representatives versus the total number of analyzed genomes within the clade is shown in parentheses. For phyla lacking chemotaxis (shown in black), only the number of genomes in the clade is shown.
Fig. 3
Fig. 3
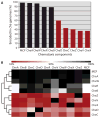
Defining a minimum set, core, and auxiliary chemotaxis components. All genomes that have at least one chemotaxis component were taken into consideration. CheY proteins were not considered because of problems with their identification (Materials and Methods). (A) Relative frequency distribution of chemotaxis components in genomes. (B) Co-occurrence of chemotaxis components in genomes. Blocks show the percentage of genomes encoding the column component that also encode the row component according to the gradient colors at the top. The tree at the left shows the results of average linkage hierarchical clustering using Euclidean distance.
Fig. 4
Fig. 4
Prevalence of chemotaxis systems in sequenced genomes. The graph includes complete genomes from all sequenced prokaryotic species available before November 2008, but the trend (a slight increase in the percentage of genomes with chemotaxis system with the increase in the number of sequences genomes) remains even when our nonredundant genome set (Materials and Methods) was used.
Fig. 5
Fig. 5
Distribution of single and multiple chemotaxis systems. The number of chemotaxis (che) systems in our genome set is defined here as the number of CheA proteins it is predicted to encode. In instances of split CheAs, only one protein was counted.
Fig. 6
Fig. 6
Defining chemotaxis system classes with phylogenomic markers. The CheA-CheB-CheR tree was rooted at its midpoint and then progressively analyzed node by node from its root nodes to its leaf nodes. At each internal node, sequences of each leaf were matched to markers to determine whether the descendants should be grouped into a single class (blue line) or split into multiple classes (yellow circle). alRT scores from PhyML are shown at each internal node. An alRT score of ≥90 is consistent with a bootstrap score of at least 75 in good-quality data sets (85), and poorly supported nodes with scores of <90 are shown in red. The markers shown in the table at the right include gene order, conserved auxiliary components in gene neighborhoods (GN), deviations from standard domain architectures of chemotaxis components in the gene neighborhoods, and the signaling domain class of neighboring MCPs (30). Gene orders and neighborhood components show CheA (A), CheB (B), CheC (C), CheD (D), CheR (R), CheV (V), CheW (W), CheX (X), CheY (Y), CheZ (Z), MCP (M), and non-CheY response regulators (O). The “:” symbol represents a fusion between components, and “…” represents one or more nonconserved or components not involved in chemotaxis, or both were found in between conserved che components or domains. The domains shown at the bottom correspond to Pfam domain models except for transmembrane regions (TM). In the table, the “Response_reg” model from Pfam has been shortened to “REC.” A divergent subfamily of F7 systems (F7-divergent) groups with F8 systems in the CheA-CheB-CheR tree; however, the individual CheA tree shows all F7 systems grouped together (fig. S1), which is supported by the presence of a single MCP class (36H) in both the F7-major and F7-divergent classes.
Fig. 7
Fig. 7
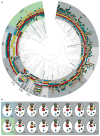
Phylogenomic classification of the chemotaxis system. (A) A maximum likelihood phylogenetic tree built from concatenated multiple sequence alignment of CheA-CheB-CheR proteins is shown in the middle. Branches corresponding to proteins that have been experimentally shown to control flagellar motility are in black, Tfp motility are in blue, and alternative cellular functions are in green (table S1). The colorful wide concentric circle around the tree shows the gene neighborhood for genes corresponding to the CheA, CheB, and CheR protein sequences on the tree. Each gene is shown as a small colored rectangle. The color scheme is the same asin Fig. 1. Background color highlights 18 classes of the chemotaxis system: ACF, green; Tfp, blue; and 16 Fla classes, light and dark gray. The F14 class is not represented because it lacks CheB and CheR. (B) Protein interaction networks reconstructed for all 19 classes of the chemotaxis system. Color code is the same as in (A). F10* represents F10, F11, F13, and F16 interaction networks. Components with outlines and interaction lines shown in light gray are not common to all members of a class.
Fig. 8
Fig. 8
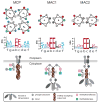
Similarities between chemoreceptors and MAC kinases. At the top, helical wheel diagrams show the chemoreceptor methylation domain, which consists of a four-helix antiparallel bundle with two helices (N and C) from each monomer (A and B), and the MAC methylation region that is predicted to be a parallel two-helix coiled coil with a helix from each monomer (A and B). Helical wheel positions are colored according to conserved small (green), glutamate (red), and leucine (black) residues shown in the corresponding sequence logos below. Sequence logos (86) show the putative methylation consensus sequences for chemoreceptors, MAC1, and MAC2 systems. The α helix heptad positions, which match the helical wheels, are shown immediately below the logos. The chemoreceptor sequence logo was built from the signaling domains of the major class receptors identified in previous work (30), which match the established [AGST]-[AGST]-X-[EQ]-[EQ]-X-[AGST]-[AGST] consensus sequence. Logos for the MAC methylation sites were built from heptads of the methylation regions with glutamate (E) in the b and c positions (figs. S8 and S9). Schematic domain representations of chemo-receptor, MAC1, and MAC2 systems are shown at the bottom. The dimeric proteins are shown with light- and dark-colored monomers. For clarity, the methylation (M) and phosphorylation (P) interactions of only one monomer are shown for each dimer. Protein domains that are common to both classic two-component and chemotaxis systems are shown in gray, whereas other colors represent components exclusive to chemotaxis and MAC systems.
Fig. 9
Fig. 9
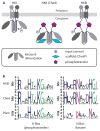
HKIIIs have an architecture intermediate between those of class I and CheA histidine kinases. (A) Schematic domain representations of the three classes of kinases are shown at the top. The dimeric proteins are shown with light- and dark-colored monomers. For clarity, the phosphorylation interactions (P) of only one monomer are shown for each dimer. Protein domains that are common to both class I and class II (CheA) kinases are shown in gray, whereas other colors represent elements typically found in CheA and HKIII histidine kinases. (B) Although the HPT domain model (Pfam:Hpt) is not always identified in HKIII proteins, the sequence logos from the putative phosphorylation site (the only conserved histidine in HKIIIs; fig. S10) support the notion that the region is a phospho-transfer domain given the similarities between sequence logos (86) built from the CheA Hpt domain and the Pfam seed alignment used to build the Hpt domain model. The N box (2) of the HKIII ATPase domains also shows similarity to the N box of CheA kinases, more so than the N box of the Pfam seed alignment used to build the HATPase_c domain model. Although a variety of histidine kinases are represented by the HATPase_c domain model including CheA kinases and DNA gyrases, most of the seed alignment members are HKIs. The H- and N-box sequence logos from the HKIII sequences correspond to positions 54 to 64 and 274 to 284, respectively, of the HKIII alignment in fig. S10.

References

    1. Ulrich LE, Koonin EV, Zhulin IB. One-component systems dominate signal transduction in prokaryotes. Trends Microbiol. 2005;13:52–56. - PMC - PubMed
    1. Stock AM, Robinson VL, Goudreau PN. Two-component signal transduction. Annu Rev Biochem. 2000;69:183–215. - PubMed
    1. Zhulin IB, Nikolskaya AN, Galperin MY. Common extracellular sensory domains in transmembrane receptors for diverse signal transduction pathways in bacteria and archaea. J Bacteriol. 2003;185:285–294. - PMC - PubMed
    1. Alekshun MN, Levy SB, Mealy TR, Seaton BA, Head JF. The crystal structure of MarR, a regulator of multiple antibiotic resistance, at 2.3 Å resolution. Nat Struct Biol. 2001;8:710–714. - PubMed
    1. Tuckerman JR, Gonzalez G, Sousa EH, Wan X, Saito JA, Alam M, Gilles-Gonzalez MA. An oxygen-sensing diguanylate cyclase and phosphodiesterase couple for c-di-GMP control. Biochemistry. 2009;48:9764–9774. - PubMed

Publication types

LinkOut - more resources