

Reliability of categorical loudness scaling and its relation to threshold
- PMID: 20588122
- PMCID: PMC3376894
- DOI: 10.1097/AUD.0b013e3181da4d15
Reliability of categorical loudness scaling and its relation to threshold
Abstract
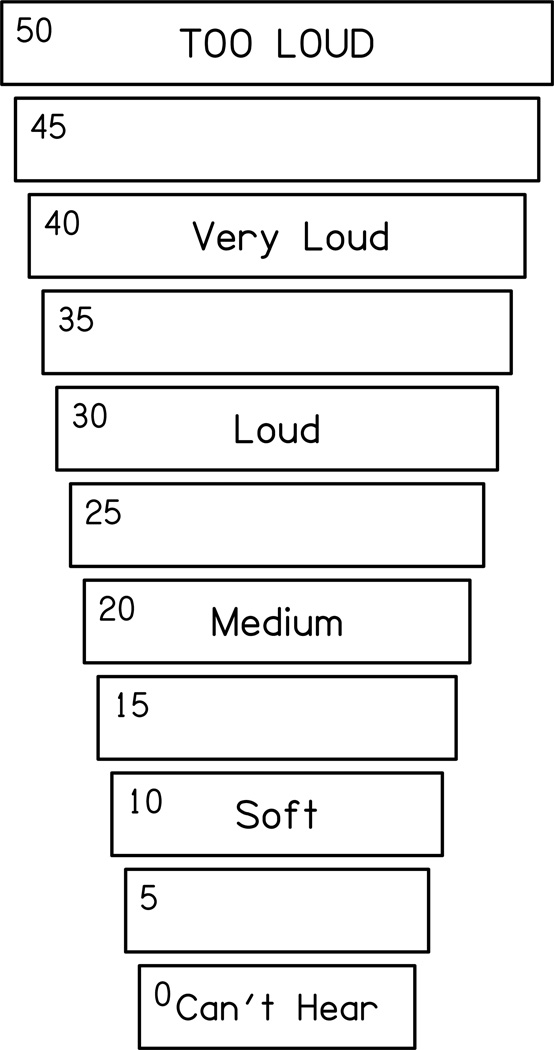
Objective: To further examine the reliability of categorical loudness scaling (CLS) for individual loudness categories and for the slope of the CLS functions. And, to evaluate the relationship between CLS and audiometric threshold.
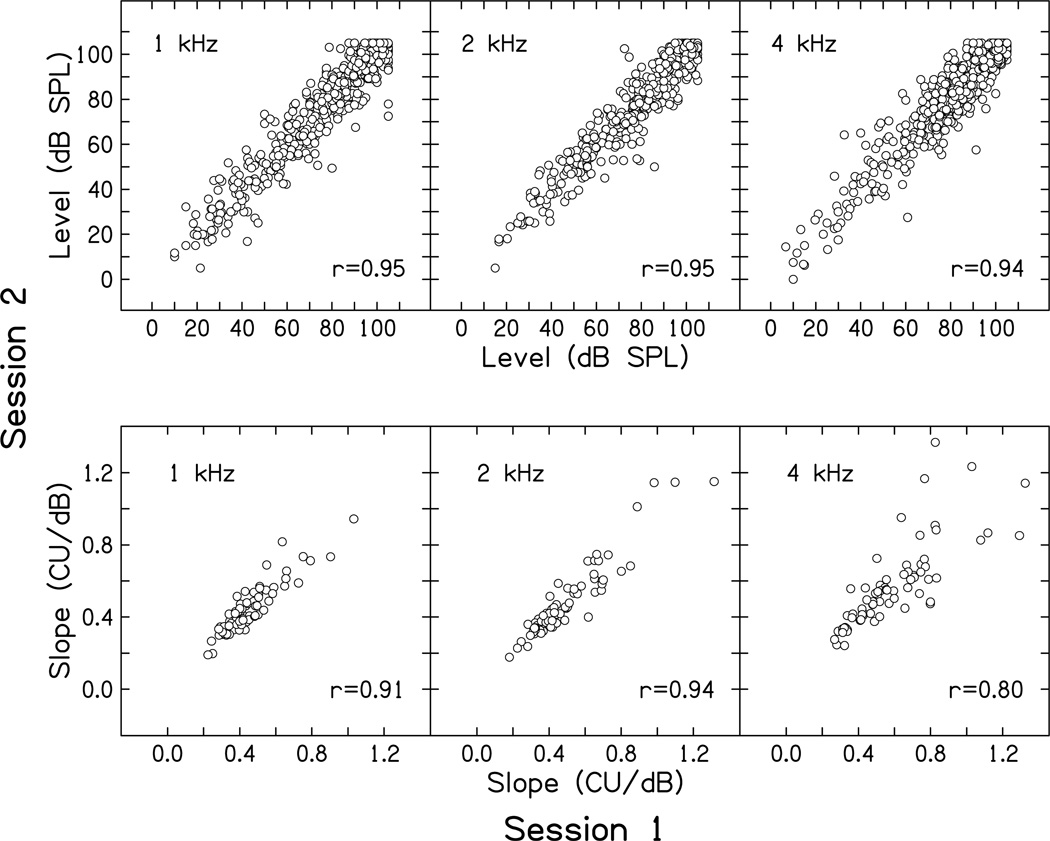
Design: CLS functions were obtained in 74 subjects, 58 with hearing loss and 16 with normal hearing. CLS functions were measured at three frequencies (1, 2, and 4 kHz) in two separate sessions separated by as little as 1 wk and as much as 6 mo. Reliability of mean and median levels within each loudness category was assessed using SDs and correlation coefficients. Lines were fit to the CLS functions, and slopes of the lines were used to assess reliability and the relation between CLS and audiometric threshold.
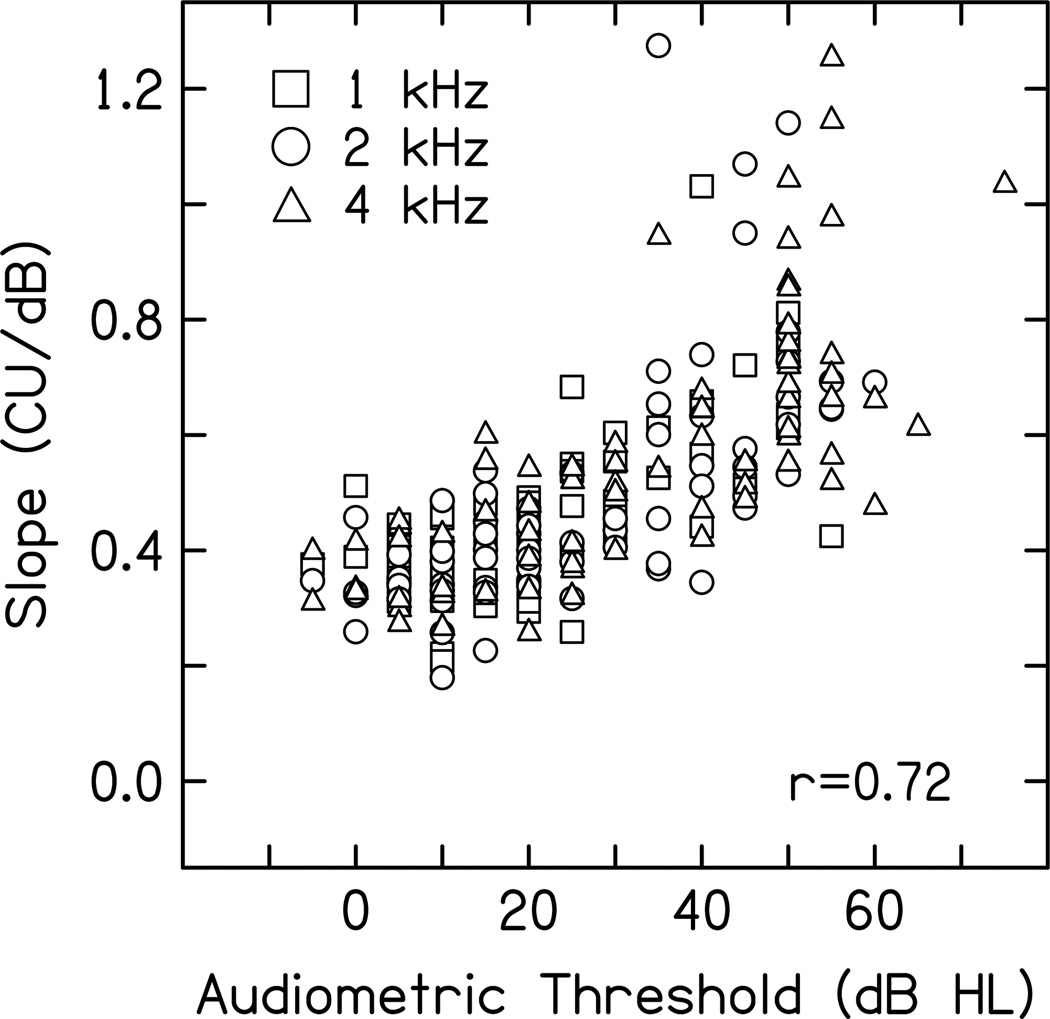
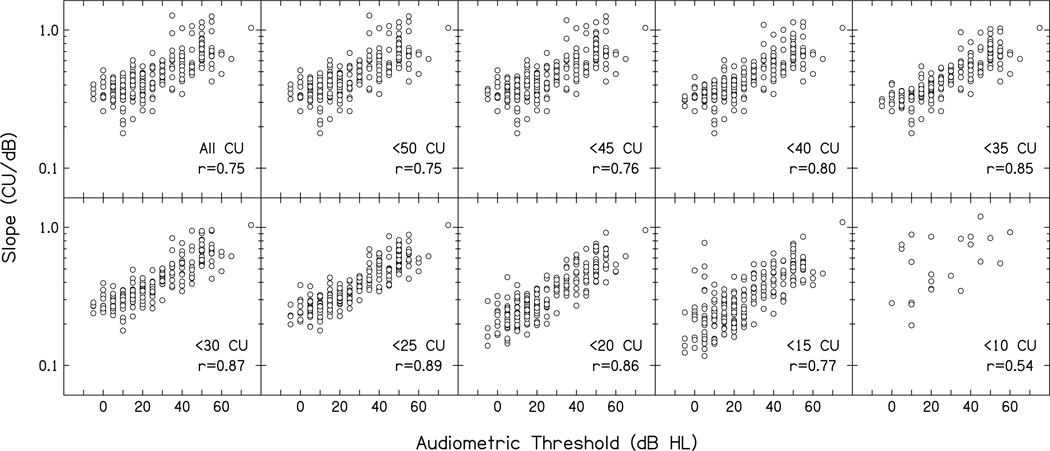
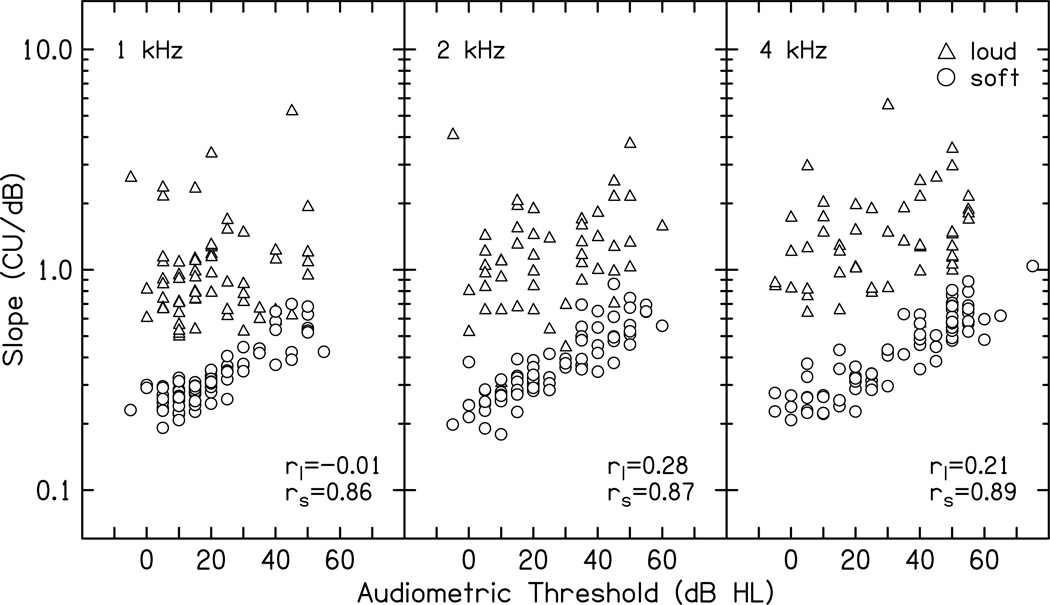
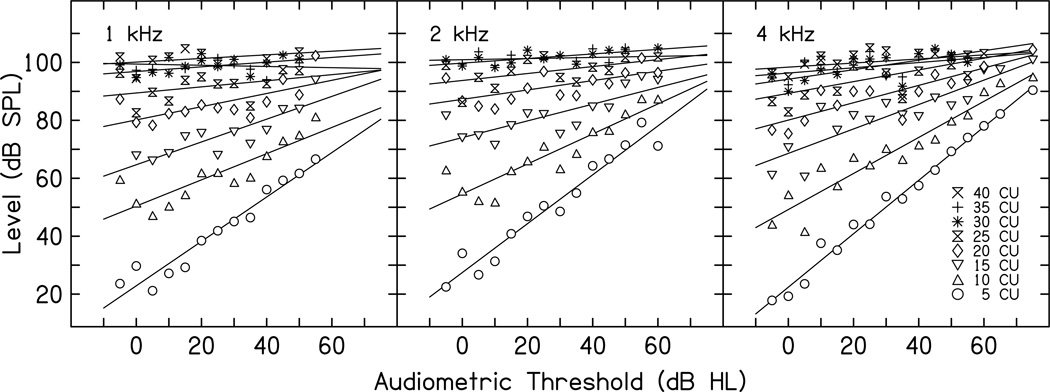
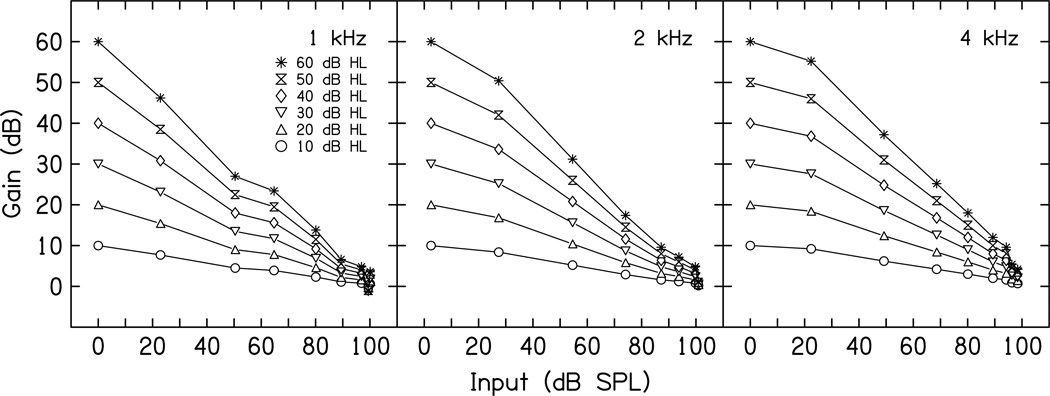
Results: Similar reliability for CLS measurements was observed in both normal-hearing and hearing-impaired subjects at all frequencies. Across both groups of subjects, correlations describing the reliability of mean stimulus level within category exceeded 0.92 at all frequencies. In addition, SDs of the mean stimulus-level difference between visits ranged from 6.6 to 7.8 dB, depending on frequency. The correlation between the slope of a straight line fitted to the entire CLS function and audiometric threshold collapsed across frequencies was 0.72. Two line segments were then fit to the CLS function: one segment was fit to the soft portion of the CLS function (categorical units < or =20) and the other segment to the loud portion (categorical unit >20). Slopes of the line fit to the entire CLS function and of the line fit to the soft portion of the CLS function were both reliable across sessions. The slope of the line fit to the soft portion increased as audiometric threshold increased, with the correlations greater than 0.86 at all frequencies. No relationship was observed between slope of the line fit to the loud portion of the CLS function and audiometric threshold. Iso-loudness contours were constructed from the CLS data and used to determine the gain that would be needed to produce "normal" loudness percepts for hearing-impaired individuals.
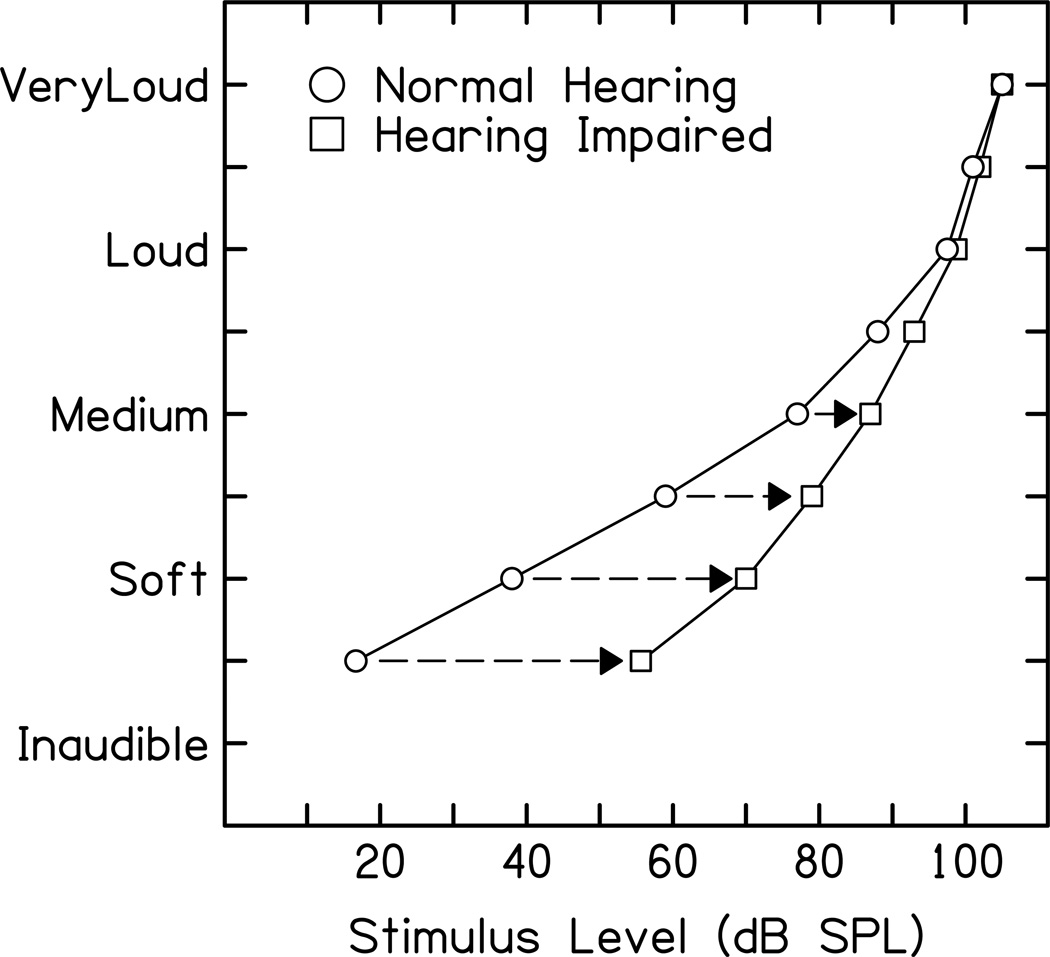
Conclusions: Within-subject CLS measurements were reliable across sessions both for individual loudness categories and for slope of the CLS functions. In addition, the slope of the low-level portion of the CLS function varied in a predictable manner with audiometric threshold, with slope increasing as audiometric threshold increased. Finally, gain as a function of input level needed to provide loudness percepts for individuals with hearing loss equal to the loudness percepts of normal-hearing individuals can be estimated from audiometric threshold. This finding supports the assumption that audiometric threshold and response growth (loudness) are both determined by the same underlying cochlear mechanisms.
Figures
References
-
- Allen JB, Hall JL, Jeng PS. Loudness growth in 1/2-octave bands (LGOB) -- A procedure for the assessment of loudness. J Acoust Soc Am. 1990;88:745–753. - PubMed
-
- Beattie RC, Huynh RC, Ngo VN, et al. IHAFF loudness contour test: Reliability and effects of approach mode in normal-hearing subjects. J Am Acad Audiol. 1997;8:243–256. - PubMed
-
- Brand T. Analysis and Optimization of Psychophysical Procedures in Audiology. Unpublished Ph.D. thesis. Oldenburg, Germany: Oldenburg University; 2000.
-
- Brand T, Hohmann V. Effect of hearing loss, centre frequency, and bandwidth on the shape of loudness functions in categorical loudness scaling. Audiology. 2001;40:92–103. - PubMed
-
- Brand T, Hohmann V. An adaptive procedure for categorical loudness scaling. J Acoust Soc Am. 2002;112:1597–1604. - PubMed
Publication types
MeSH terms
Grants and funding
LinkOut - more resources
Full Text Sources
Other Literature Sources
Miscellaneous
