. 2010 Apr 12;18(8):7835-50.
doi: 10.1364/OE.18.007835.

Quantitative fluorescence tomography using a combined tri-modality FT/DOT/XCT system

Affiliations

Quantitative fluorescence tomography using a combined tri-modality FT/DOT/XCT system

Yuting Lin et al. Opt Express. .

Abstract

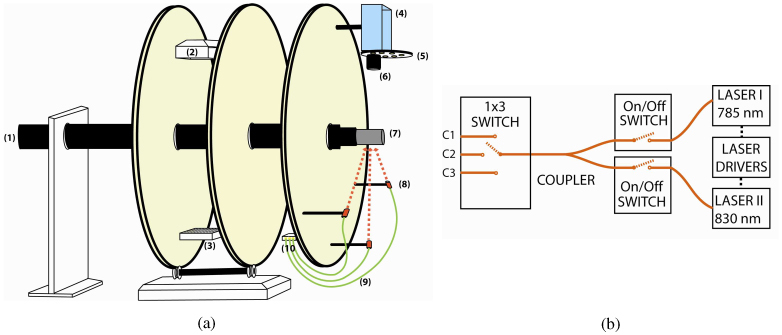
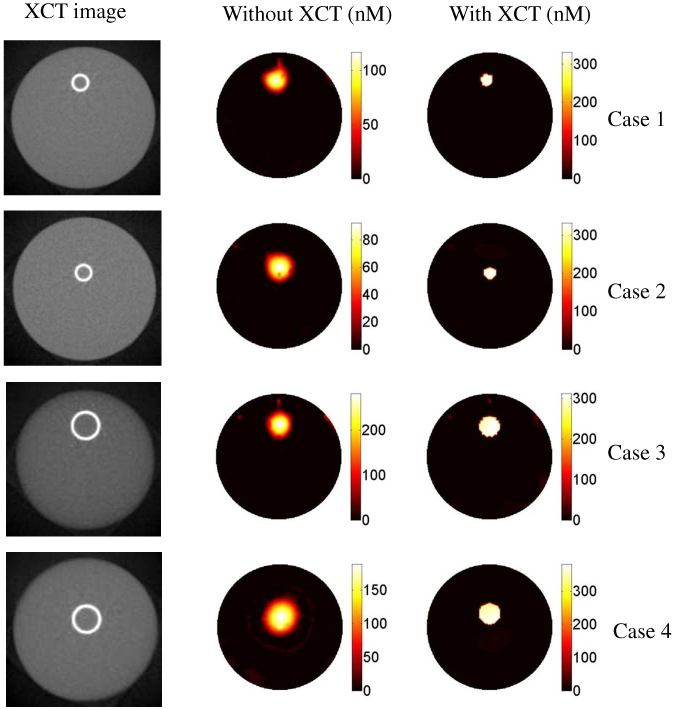
In this work, a first-of-its-kind fully integrated tri-modality system that combines fluorescence, diffuse optical and x-ray tomography (FT/DOT/XCT) into the same setting is presented. The purpose of this system is to perform quantitative fluorescence tomography using multi-modality imaging approach. XCT anatomical information is used as structural priori while optical background heterogeneity information obtained by DOT measurements is used as functional priori. The performance of the hybrid system is evaluated using multi-modality phantoms. In particular, we show that a 2.4 mm diameter fluorescence inclusion located in a heterogeneous medium can be localized accurately with the functional a priori information, although the fluorophore concentration is recovered with 70% error. On the other hand, the fluorophore concentration can be accurately recovered within 8% error only when both DOT optical background functional and XCT structural a priori information are utilized to guide and constrain the FT reconstruction algorithm.


Figures

Fig. 2
Fig. 2
(a) The picture of the system from the side view showing the XCT counterpart. The x-ray source (top) and the flat panel detector (bottom) are positioned on a rotating gantry. All the electrical connections transferred to the gantry using wire harness belts. (b) The picture of the system from the front view showing the FT/DOT components.
Fig. 1
Fig. 1
(a) The schematic of the multi-modality gantry-based system. The XCT gantry was expanded and optical imaging components were installed. A sample holder was designed to translate the sample between XCT and optical imaging systems. The components that are seen in the diagram: (1) the sample holder, (2) x-ray source, (3) x-ray detector, (4) CCD camera, (5) filter wheel, (6) lens, (7) phantom, (8) fiber optic collimator, (9) optical fibers, (10) fiber optic switch. (b) The light delivery components. On-off switches were used to select the desired illumination wavelength. A 50/50 fiber optic coupler was used to combine both laser output. A 1 x 3 fiber optic switch allowed the sequential activation of any one the three source sites.
Fig. 3
Fig. 3
a) The trans-axial XCT image of the phantom. The ICG inclusion is held in the glass tube that is seen as a bright circle in the image. b) The plot of the recovered ICG concentration with respect to true ICG concentration. The blue and purple dots represent the recovered values with and without the structural a priori information, respectively. The least squares lines of best fit are the red dashed ones. The recovered ICG concentration shows a linear response with respect to true ICG concentration both with and without the structural a priori information. However, the right values are recovered only when structural a priori information is available.
Fig. 4
Fig. 4
The reconstructed ICG concentration maps without (left column) and with (right column) structural a priori information from XCT for the first phantom study. The color bars all have units of nM.
Fig. 5
Fig. 5
The results for the second phantom study. The first column is the XCT trans-axial images of the phantoms. The size and location of the inclusion are different for each case. The second the third columns are the reconstructed ICG concentration maps without and with the XCT structural a priori information, respectively. As seen in the images, the recovered ICG concentration value depends drastically on the size and location of the inclusion. However, the true value can be recovered for all four cases when XCT structural a priori information is used. The color bars all have the units of nM.
Fig. 6
Fig. 6
(a) The XCT trans-axial image of the heterogeneous phantom. b) The reconstructed absorption map at 785 nm using DOT measurements. The reconstructed ICG concentration maps without any a priori information (c), with functional a priori information alone (d), and with both functional and structural a priori information (e). The profile plot along the x-axis across the reconstructed fluorescence object (indicated by the dashed white line) for each case is superimposed and shown in (f). The profile plot along the x-axis across the glass tube (indicated by yellow dashed line in the XCT image) is also shown in (g).
Fig. 7
Fig. 7
The reconstructed ICG concentration maps without (a) and with (b) XCT structural a priori information. The profile plot along the x-axis across the reconstructed fluorescence object (indicated by the dashed white line) for each case is superimposed and shown in (c).
Fig. 8
Fig. 8
(a) The XCT trans-axial image of the phantom with two ICG inclusions. (b) and (c) The reconstructed ICG concentration maps without and with XCT structural a priori information. Without XCT structural a priori information, the object closer to the surface dominates in the image. On the other hand, both ICG inclusions can be accurately recovered when XCT structural a priori information is used.

Similar articles

Cited by

References

    1. Weissleder R., Tung C. H., Mahmood U., Bogdanov A., Jr, “In vivo imaging of tumors with protease-activated near-infrared fluorescent probes,” Nat. Biotechnol. 17(4), 375–378 (1999).10.1038/7933 - DOI - PubMed
    1. Tung C. H., Bredow S., Mahmood U., Weissleder R., “Preparation of a cathepsin D sensitive near-infrared fluorescence probe for imaging,” Bioconjug. Chem. 10(5), 892–896 (1999).10.1021/bc990052h - DOI - PubMed
    1. Chen X., Conti P. S., Moats R. A., “In vivo near-infrared fluorescence imaging of integrin alphavbeta3 in brain tumor xenografts,” Cancer Res. 64(21), 8009–8014 (2004).10.1158/0008-5472.CAN-04-1956 - DOI - PubMed
    1. Cheng Z., Wu Y., Xiong Z., Gambhir S. S., Chen X., “Near-infrared fluorescent RGD peptides for optical imaging of integrin alphavbeta3 expression in living mice,” Bioconjug. Chem. 16(6), 1433–1441 (2005).10.1021/bc0501698 - DOI - PMC - PubMed
    1. Koenig A., Hervé L., Josserand V., Berger M., Boutet J., Da Silva A., Dinten J. M., Peltié P., Coll J. L., Rizo P., “In vivo mice lung tumor follow-up with fluorescence diffuse optical tomography,” J. Biomed. Opt. 13(1), 011008 (2008).10.1117/1.2884505 - DOI - PubMed

Publication types