. 2010 Jun 7:4:16.
doi: 10.3389/fnsys.2010.00016. eCollection 2010.

Graph-based network analysis of resting-state functional MRI

Affiliations

Graph-based network analysis of resting-state functional MRI

Jinhui Wang et al. Front Syst Neurosci. .

Abstract

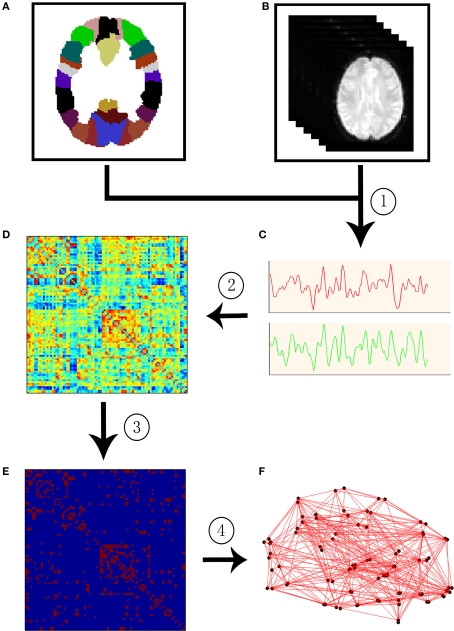
In the past decade, resting-state functional MRI (R-fMRI) measures of brain activity have attracted considerable attention. Based on changes in the blood oxygen level-dependent signal, R-fMRI offers a novel way to assess the brain's spontaneous or intrinsic (i.e., task-free) activity with both high spatial and temporal resolutions. The properties of both the intra- and inter-regional connectivity of resting-state brain activity have been well documented, promoting our understanding of the brain as a complex network. Specifically, the topological organization of brain networks has been recently studied with graph theory. In this review, we will summarize the recent advances in graph-based brain network analyses of R-fMRI signals, both in typical and atypical populations. Application of these approaches to R-fMRI data has demonstrated non-trivial topological properties of functional networks in the human brain. Among these is the knowledge that the brain's intrinsic activity is organized as a small-world, highly efficient network, with significant modularity and highly connected hub regions. These network properties have also been found to change throughout normal development, aging, and in various pathological conditions. The literature reviewed here suggests that graph-based network analyses are capable of uncovering system-level changes associated with different processes in the resting brain, which could provide novel insights into the understanding of the underlying physiological mechanisms of brain function. We also highlight several potential research topics in the future.

Keywords: brain; functional MRI; functional connectivity; graph theory; human connectome; network; resting-state; small-world.


Figures

Figure 1
Figure 1
A flowchart for the construction of functional brain network in the human brain by R-fMRI. (1) Extraction of the time course (C) from R-fMRI data (B) within each anatomical unit (i.e., network node). (B) Anatomical units are obtained according to a prior brain atlas (A) or voxels; (2) Calculation of a functional connectivity (i.e., network edge) correlation matrix (D) between any pairs of nodes; (3) Thresholding the correlation matrix into a binary connectivity matrix (i.e., association matrix, E); (4) Visualization of the association matrix as a graph (F).
Figure 2
Figure 2
The modular architecture of resting-state functional brain network (He et al., 2009b). (A) Five modules were identified in a functional network of the human brain, represented by five different colors. The geometric distance between brain regions on the drawing space approximates the shortest path length between them. The network is visualized with Pajek (http://vlado.fmf.uni-lj.si/pub/networks/pajek/). The intra-module and inter-module connections are shown in gray and dark lines, respectively. For the abbreviations of the regions, see He et al. (2009b). (B) Surface representation of modular architecture of a functional brain network. All 90 brain regions are marked by using different colored spheres (different colors represent distinct network modules) and further mapped onto the cortical surfaces in the lateral and medial views, respectively. Notably, the regions are located according to their centroid stereotaxic coordinates. For visualization purposes, the subcortical regions are projected to the medial cortical surface according to their y and z centroid stereotaxic coordinates.

References

    1. Achard S., Bullmore E. T. (2007). Efficiency and cost of economical brain functional networks. PLoS Comput. Biol. 3, e17.10.1371/journal.pcbi.0030017 - DOI - PMC - PubMed
    1. Achard S., Salvador R., Whitcher B., Suckling J., Bullmore E. T. (2006). A resilient, low-frequency, small-world human brain functional network with highly connected association cortical hubs. J. Neurosci. 26, 63–7210.1523/JNEUROSCI.3874-05.2006 - DOI - PMC - PubMed
    1. Bang-Jensen J., Gutin G. Z. (2008). Digraphs: Theory, Algorithms and Applications Berlin: Springer-Verlag Press
    1. Bassett D. S., Bullmore E. T. (2006). Small-world brain networks. Neuroscientist. 12, 512–52310.1177/1073858406293182 - DOI - PubMed
    1. Bassett D. S., Bullmore E. T. (2009). Human brain networks in health and disease. Curr. Opin. Neurol. 22, 340–34710.1097/WCO.0b013e32832d93dd - DOI - PMC - PubMed