

Enhanced sampling and applications in protein folding in explicit solvent
- PMID: 20590175
- PMCID: PMC2905458
- DOI: 10.1063/1.3435332
Enhanced sampling and applications in protein folding in explicit solvent
Abstract
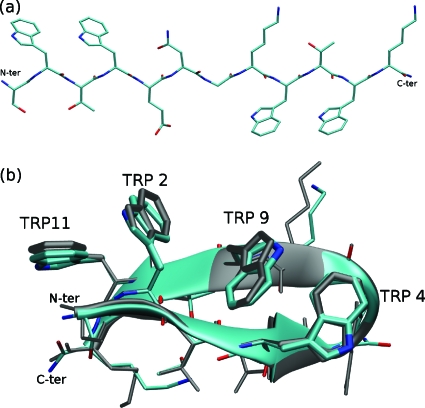
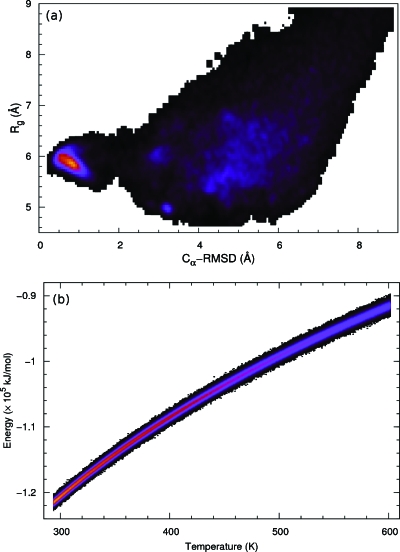
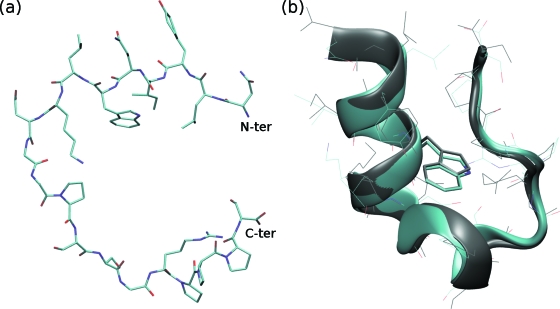
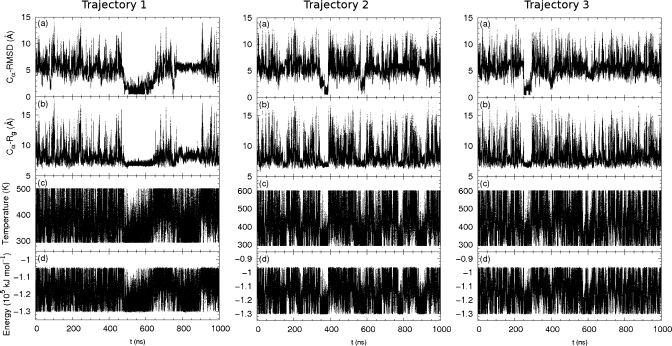
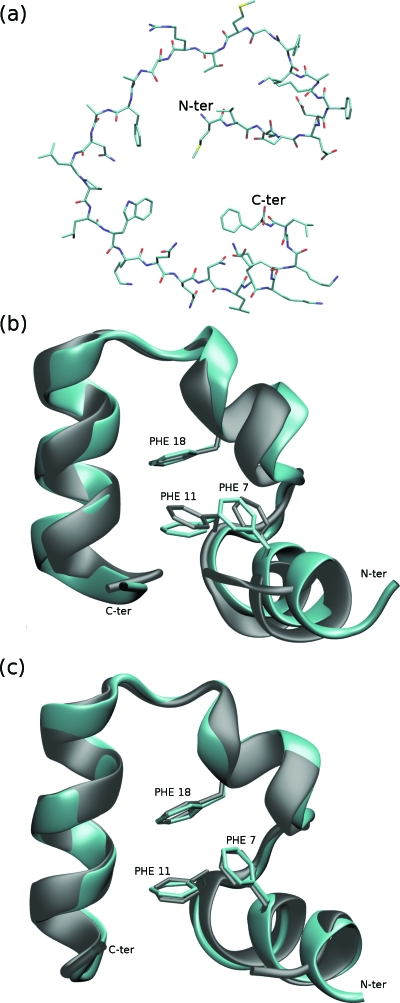
We report a single-copy tempering method for simulating large complex systems. In a generalized ensemble, the method uses runtime estimate of the thermal average energy computed from a novel integral identity to guide a continuous temperature-space random walk. We first validated the method in a two-dimensional Ising model and a Lennard-Jones liquid system. It was then applied to folding of three small proteins, trpzip2, trp-cage, and villin headpiece in explicit solvent. Within 0.5-1 microsecond, all three systems were reversibly folded into atomic accuracy: the alpha carbon root mean square deviations of the best folded conformations from the native states were 0.2, 0.4, and 0.4 A, for trpzip2, trp-cage, and villin headpiece, respectively.
Figures
Similar articles
-
Examining a Thermodynamic Order Parameter of Protein Folding.Sci Rep. 2018 May 8;8(1):7148. doi: 10.1038/s41598-018-25406-8. Sci Rep. 2018. PMID: 29740018 Free PMC article.
-
Equilibrium kinetic network of the villin headpiece in implicit solvent.Biophys J. 2015 Jan 20;108(2):368-78. doi: 10.1016/j.bpj.2014.11.3476. Biophys J. 2015. PMID: 25606685 Free PMC article.
-
Parallel continuous simulated tempering and its applications in large-scale molecular simulations.J Chem Phys. 2014 Jul 28;141(4):044113. doi: 10.1063/1.4890038. J Chem Phys. 2014. PMID: 25084887 Free PMC article.
-
Enhanced conformational sampling to visualize a free-energy landscape of protein complex formation.Biochem J. 2016 Jun 15;473(12):1651-62. doi: 10.1042/BCJ20160053. Biochem J. 2016. PMID: 27288028 Free PMC article. Review.
-
Describing sequence-ensemble relationships for intrinsically disordered proteins.Biochem J. 2013 Jan 15;449(2):307-18. doi: 10.1042/BJ20121346. Biochem J. 2013. PMID: 23240611 Free PMC article. Review.
Cited by
-
Protein Folding and Structure Prediction from the Ground Up: The Atomistic Associative Memory, Water Mediated, Structure and Energy Model.J Phys Chem B. 2016 Aug 25;120(33):8557-65. doi: 10.1021/acs.jpcb.6b02451. Epub 2016 May 13. J Phys Chem B. 2016. PMID: 27148634 Free PMC article.
-
Equilibrium sampling in biomolecular simulations.Annu Rev Biophys. 2011;40:41-62. doi: 10.1146/annurev-biophys-042910-155255. Annu Rev Biophys. 2011. PMID: 21370970 Free PMC article. Review.
-
Trends in template/fragment-free protein structure prediction.Theor Chem Acc. 2011 Jan;128(1):3-16. doi: 10.1007/s00214-010-0799-2. Epub 2010 Sep 1. Theor Chem Acc. 2011. PMID: 21423322 Free PMC article.
-
GPCR Intracellular Loop Regulation of Beta-Arrestin-Mediated Endosomal Signaling Dynamics.J Mol Neurosci. 2022 Jun;72(6):1358-1373. doi: 10.1007/s12031-022-02016-8. Epub 2022 May 10. J Mol Neurosci. 2022. PMID: 35538393 Free PMC article.
-
Generalized simulated tempering for exploring strong phase transitions.J Chem Phys. 2010 Oct 21;133(15):154101. doi: 10.1063/1.3503503. J Chem Phys. 2010. PMID: 20969364 Free PMC article.
References
-
- Lyubartsev A. P., Martsinovski A. A., Shevkunov S. V., and Vorontsovvelyaminov P. N., J. Chem. Phys. JCPSA6 96, 1776 (1992)10.1063/1.462133 - DOI
- Marinari E. and Parisi G., Europhys. Lett. EULEEJ 19, 451 (1992)10.1209/0295-5075/19/6/002 - DOI
- Zhang C. and Ma J., Phys. Rev. E PLEEE8 76, 036708 (2007)10.1103/PhysRevE.76.036708 - DOI - PMC - PubMed
- Li H., Fajer M., and Yang W., J. Chem. Phys. JCPSA6 126, 024106 (2007)10.1063/1.2424700 - DOI - PubMed
- Gao Y. Q., J. Chem. Phys. JCPSA6 128, 064105 (2008);10.1063/1.2825614 - DOI - PubMed
- Kim J., Straub J. E., and Keyes T., Phys. Rev. Lett. PRLTAO 97, 050601 (2006).10.1003/PhysRevLett.97.050601 - DOI - PubMed
-
- Geyer C. J., Proceedings of the 23rd Symposium on the Interface (American Statistical Association, New York, 1991)
- Hansmann U. H. E., Chem. Phys. Lett. CHPLBC 281, 140 (1997)10.1016/S0009-2614(97)01198-6 - DOI
- Hukushima K. and Nemoto K., J. Phys. Soc. Jpn. JUPSAU 65, 1604 (1996)10.1143/JPSJ.65.1604 - DOI
- Swendsen R. H. and Wang J. S., Phys. Rev. Lett. PRLTAO 57, 2607 (1986);10.1103/PhysRevLett.57.2607 - DOI - PubMed
- Kim J., Straub J. E., and Keyes T., J. Chem. Phys. JCPSA6 132, 224107 (2010).10.1063/1.3432176 - DOI - PMC - PubMed
Publication types
MeSH terms
Substances
Grants and funding
LinkOut - more resources
Full Text Sources