. 2010 Jul;47(4):368-77.
doi: 10.1597/09-059.1.

Three-dimensional head shape quantification for infants with and without deformational plagiocephaly

Affiliations

Three-dimensional head shape quantification for infants with and without deformational plagiocephaly

I Atmosukarto et al. Cleft Palate Craniofac J. 2010 Jul.

Abstract

Objective: The authors developed and tested three-dimensional (3D) indices for quantifying the severity of deformational plagiocephaly (DP).

Design: The authors evaluated the extent to which infants with and without DP (as determined by clinic referral and two experts' ratings) could be correctly classified.

Participants: Infants aged 4 to 11 months, including 154 with diagnosed DP and 100 infants without a history of DP or other craniofacial condition. After excluding participants with discrepant expert ratings, data from 90 infants with DP and 50 infants without DP were retained.

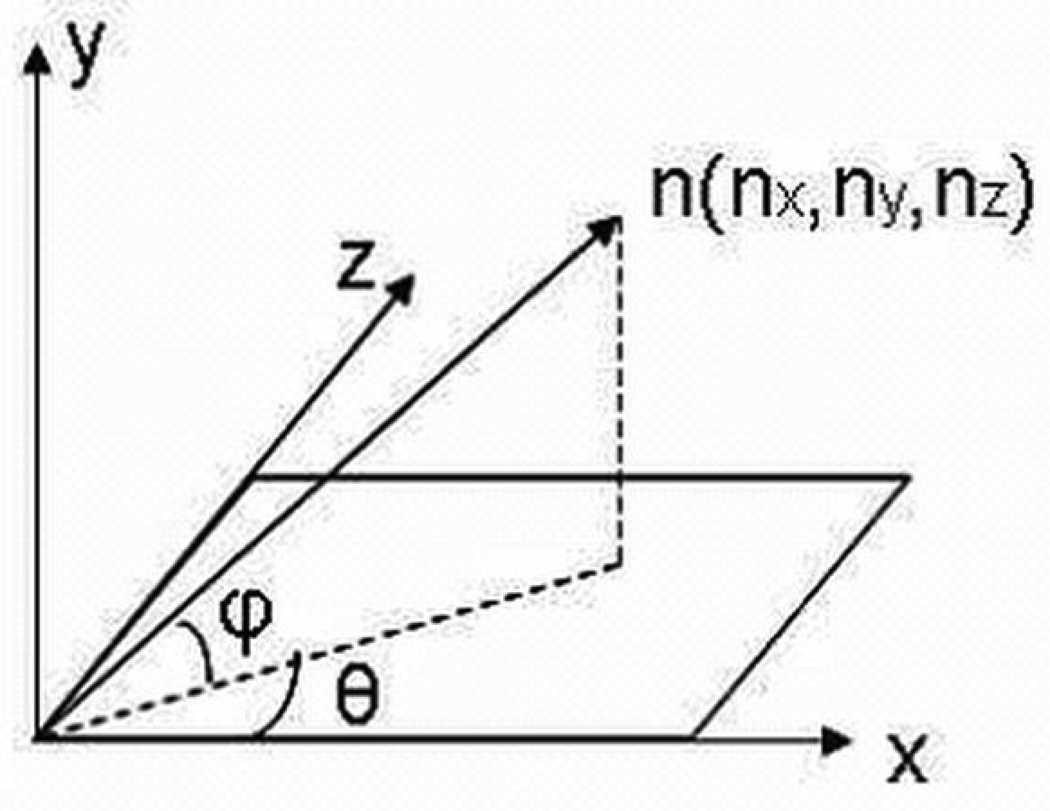
Measurements: Two-dimensional (2D) histograms of surface normal vector angles were extracted from 3D mesh data and used to compute the severity scores.

Outcome measures: Left posterior flattening score (LPFS), right posterior flattening score (RPFS), asymmetry score (AS), absolute asymmetry score (AAS), and an approximation of a previously described 2D measure, the oblique cranial length ratio (aOCLR). Two-dimensional histograms localized the posterior flatness for each participant.

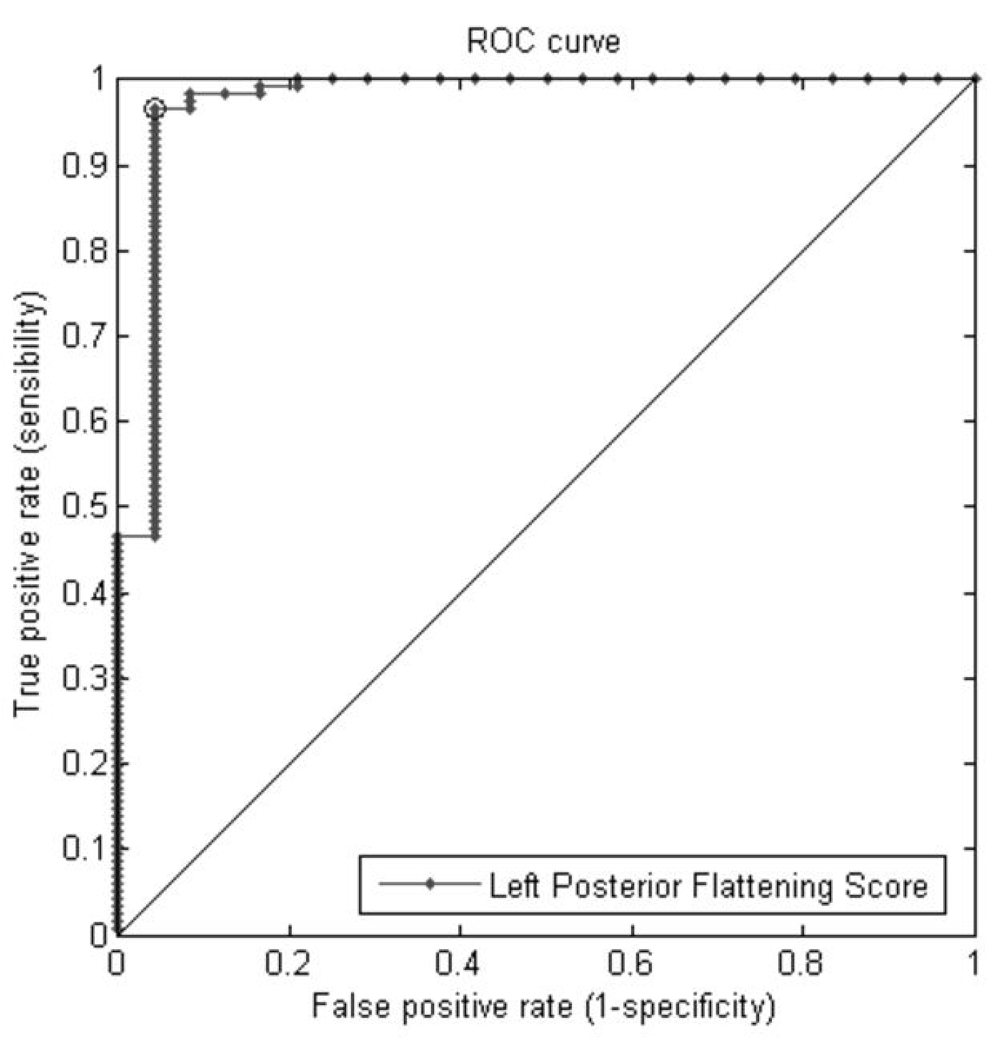
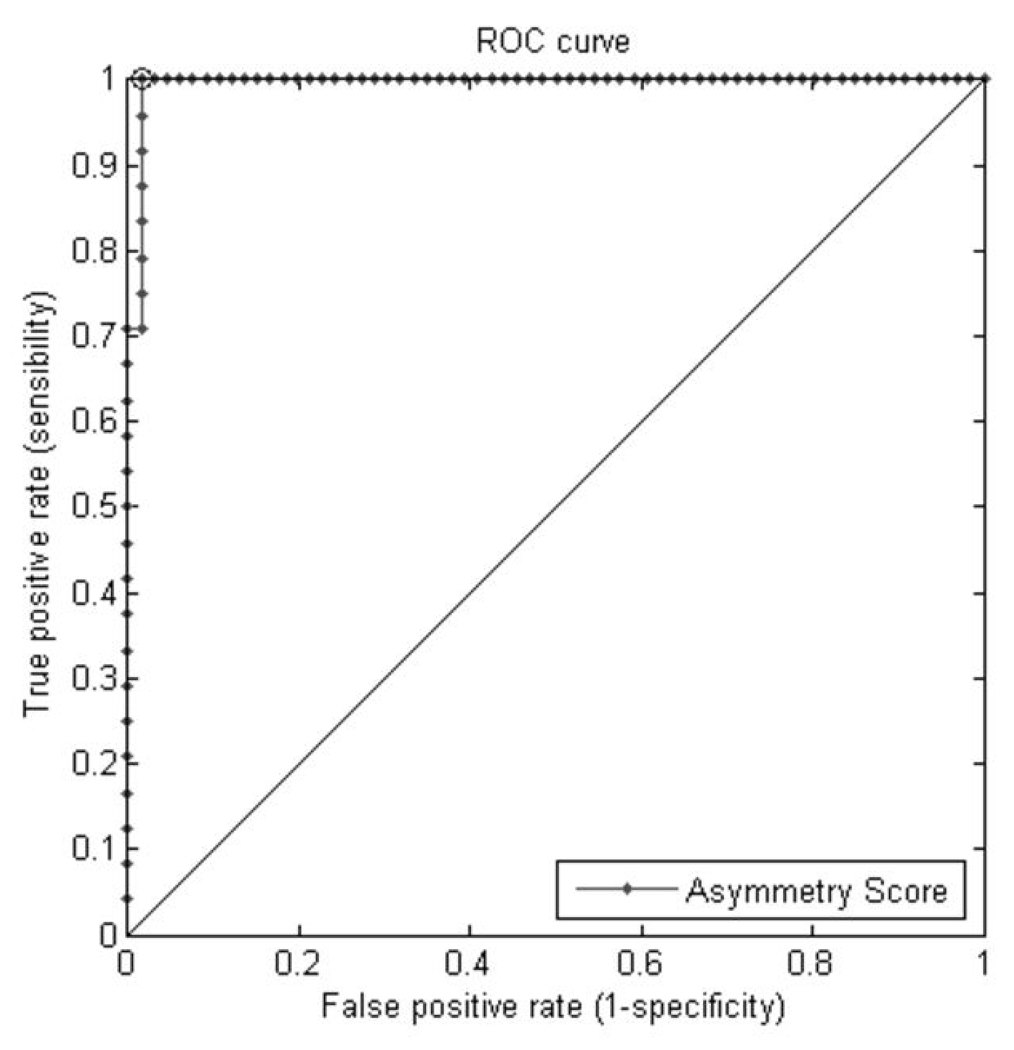
Analysis: The authors fit receiver operating characteristic curves and calculated the area under the curves (AUC) to evaluate the relative accuracy of DP classification using the above measures.

Results: The AUC statistics were AAS = 91%, LPFS = 97%, RPFS = 91%, AS = 99%, and aOCLR = 79%.

Conclusion: Novel 3D-based plagiocephaly posterior severity scores provided better sensitivity and specificity in the discrimination of plagiocephalic and typical head shapes than the 2D measurements provided by a close approximation of OCLR. These indices will allow for more precise quantification of the DP phenotype in future studies on the prevalence of this condition, which may lead to improved clinical care.


Figures

Figure 1
Figure 1
(a) 3-D head mesh and orientation of a 3-D head mesh with respect to the x, y, and z axis in 3-D space (b) Azimuth angle θ and elevation angles φ of a surface normal vector n.
Figure 1
Figure 1
(a) 3-D head mesh and orientation of a 3-D head mesh with respect to the x, y, and z axis in 3-D space (b) Azimuth angle θ and elevation angles φ of a surface normal vector n.
Figure 2
Figure 2
(a) The surface normal vectors of points that lie on a flat surface tend to have similar azimuth and elevation angles. (b) The surface normal vectors of points that lie on a more rounded surface have a wider distribution of angles.
Figure 2
Figure 2
(a) The surface normal vectors of points that lie on a flat surface tend to have similar azimuth and elevation angles. (b) The surface normal vectors of points that lie on a more rounded surface have a wider distribution of angles.
Figure 3
Figure 3
(a) 2-D Histogram of azimuth elevation angles of surface normal vector angles. The Left Posterior Flattening Score is computed by summing the values of the bins highlighted in red, while Right Posterior Flattening Score is computed by summing the values of the bins highlighted in green. (b) Back view of the head showing the points whose surface normal vector angles correspond to the selected bins’ azimuth-elevation angle combination highlighted in the 2-D histogram.
Figure 3
Figure 3
(a) 2-D Histogram of azimuth elevation angles of surface normal vector angles. The Left Posterior Flattening Score is computed by summing the values of the bins highlighted in red, while Right Posterior Flattening Score is computed by summing the values of the bins highlighted in green. (b) Back view of the head showing the points whose surface normal vector angles correspond to the selected bins’ azimuth-elevation angle combination highlighted in the 2-D histogram.
Figure 4
Figure 4
(a) Mesh surface depictions of seven skulls representative of possible deformational plagiocephaly severity scores from expert clinician ratings. (b) Relevant bins of 2-D histogram of azimuth and elevation angles of surface normal vectors on 3-D head mesh models. These bins are used to calculate the various deformation severity indices. As the severity of posterior flatness increases on the side of the head, the peak in the 2-D histogram becomes more prominent as shown by the warmer colors (red, yellow, green). (c)The last row shows the localization of the posterior flatness, where the flat areas are colored in a similar shade as their corresponding histogram bins.
Figure 5
Figure 5
Correlations between Left Posterior Flattening Score and Expert Score. The optimal threshold at 0.15 (thick line) distinguishes the cases with left posterior flattening (enclosed in box) from the rest of the participants.
Figure 6
Figure 6
Correlations between Right Posterior Flattening Score and Expert Score. The optimal threshold at 0.15 (thick line) distinguishes the cases with right posterior flattening (enclosed in box) from the rest of the participants.
Figure 7
Figure 7
Correlations between Asymmetry Score and Expert Score. A threshold at value = 0 produces a clear distinction between cases with left posterior flattening (enclosed in the box in the lower left quadrant) and cases with right posterior flattening(enclosed in the box in the upper right quadrant).
Figure 8
Figure 8
Correlations between the Absolute Asymmetry Score and Expert Score. Setting threshold at value 0.0352 (thick line) provides a reasonable classification of non-DP control participants versus DP cases participants.
Figure 9
Figure 9
Correlation between the Absolute Asymmetry Score and the approximate Oblique Cranial Ratio Length.
Figure 10
Figure 10
Figure 10(a) Receiver Operating Characteristic (ROC) using Left Posterior Flattening Score (LPFS) curves for classification of cases with left posterior flattening versus other participants. The sensitivity and specificity at which the AUC is maximized (marked point on the graph) are 96.6% and 95.8% respectively. Figure 10(b) Receiver Operating Characteristic (ROC) curves using Right Posterior Flattening Score (RPFS) for classification of cases with right posterior flattening versus other participants. The sensitivity and specificity at which the AUC is maximized (marked point on the graph) are 91.9% and 86.4% respectively. Figure 10(c) Receiver Operating Characteristic (ROC) curves using Asymmetry Score (AS) for classification of patients with left posterior flattening versus patients with right posterior flattening. The sensitivity and specificity at which the AUC is maximized (marked point on the graph) are 100% and 98.5% respectively. Figure 10(d) Receiver Operating Characteristic (ROC) curves for classification of patients with posterior flattening versus non-DP controls using Absolute Asymmetry Score (AAS) and approximate Oblique Cranial Length Ratio (aOCLR). The performance of AAS is better than that of aOCLR. The sensitivity and specificity at which the AUC is maximized (marked point on the graph) are 96% and 80% respectively.
Figure 10
Figure 10
Figure 10(a) Receiver Operating Characteristic (ROC) using Left Posterior Flattening Score (LPFS) curves for classification of cases with left posterior flattening versus other participants. The sensitivity and specificity at which the AUC is maximized (marked point on the graph) are 96.6% and 95.8% respectively. Figure 10(b) Receiver Operating Characteristic (ROC) curves using Right Posterior Flattening Score (RPFS) for classification of cases with right posterior flattening versus other participants. The sensitivity and specificity at which the AUC is maximized (marked point on the graph) are 91.9% and 86.4% respectively. Figure 10(c) Receiver Operating Characteristic (ROC) curves using Asymmetry Score (AS) for classification of patients with left posterior flattening versus patients with right posterior flattening. The sensitivity and specificity at which the AUC is maximized (marked point on the graph) are 100% and 98.5% respectively. Figure 10(d) Receiver Operating Characteristic (ROC) curves for classification of patients with posterior flattening versus non-DP controls using Absolute Asymmetry Score (AAS) and approximate Oblique Cranial Length Ratio (aOCLR). The performance of AAS is better than that of aOCLR. The sensitivity and specificity at which the AUC is maximized (marked point on the graph) are 96% and 80% respectively.

References

    1. 3-DMD. 3-DMDcranialTM System. Atlanta, GA: 2004.
    1. Argenta LC, David LR, Wilson J, Bell WO. An increase in infant cranial deformity with supine sleep positioning. J Craniofac Surg. 1996;7:5–11. - PubMed
    1. Bialocerkowski AE, Vladusic SL, Howell SM. Conservative interventions for positional plagiocephaly: a systematic review. Developmental Medicine & Child Neurology. 2005;47:563–570. - PubMed
    1. Bialocerkowski AE, Vladusic SL, Ng CW. Prevalence, risk factors, and natural history of positional plagiocephaly: A systematic review. Developmental Medicine & Child Neurolog. 2008;50:577–586. - PubMed
    1. Collett B, Breiger D, King D, Cunningham M, Speltz ML. Neurodevelopmental implications of “deformational” plagiocephaly. Developmental and Behavioral Pediatrics. 2005 Oct;26(5):379–389. - PMC - PubMed

Publication types