. 2010 Jul;160(6):1326-37.
doi: 10.1111/j.1476-5381.2010.00751.x.

Failure of Bay K 8644 to induce RhoA kinase-dependent calcium sensitization in rabbit blood vessels

Affiliations

Failure of Bay K 8644 to induce RhoA kinase-dependent calcium sensitization in rabbit blood vessels

S M Alvarez et al. Br J Pharmacol. 2010 Jul.

Abstract

Background and purpose: RhoA kinase (ROCK) participates in K(+) depolarization (KCl)-induced Ca(2+) sensitization of contraction. Whether constitutive, depolarization- or Ca(2+)-activated ROCK plays the major role in this signalling system remains to be determined. Here, we determined whether Bay K 8644, a dihydropyridine that promotes Ca(2+) channel clusters to operate in a persistent Ca(2+) influx mode, could cause ROCK-dependent Ca(2+) sensitization.

Experimental approach: Renal and femoral artery rings from New Zealand white rabbits were contracted with Bay K 8644. Tissues were frozen and processed to measure active RhoA and ROCK substrate (myosin phosphatase targeting subunit, MYPT1) and myosin light chain (MLC) phosphorylation, or loaded with fura-2 to measure intracellular free Ca(2+) ([Ca(2+)](i)). Effects of selective inhibitors of contraction were assessed in resting (basal) tissues and those contracted with Bay K 8644.

Key results: Bay K 8644 produced strong increases in [Ca(2+)](i), MLC phosphorylation and tension, but not in MYPT1 phosphorylation. ROCK inhibition by H-1152 abolished basal MYPT1-pT853, diminished basal MLC phosphorylation and inhibited Bay K 8644-induced increases in MLC phosphorylation and tension. MLC kinase inhibition by wortmannin abolished Bay K 8644-induced contraction and increase in MLC phosphorylation but did not inhibit basal MYPT1-pT853. H-1152 and wortmannin had no effect on MYPT1-pT696, but 1 microM staurosporine inhibited basal MYPT1-pT853, MYPT1-pT696 and MLC phosphorylation.

Conclusions and implications: These data suggest that the constitutive activities of ROCK and a staurosporine-sensitive kinase regulate basal phosphorylation of MYPT1, which participates along with activation of MLC kinase in determining the strength of contraction induced by the Ca(2+) agonist, Bay K 8644.


Figures
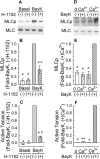
Figure 2
Figure 2
Effect of 30 nM Bay K 8644 (BayK) on myosin light chain phosphorylation (MLCp, A,B) and tension (C), and the effects of 1 µM H-1152 and a Ca2+-free solution (0 Ca2+) on basal and BayK-induced increases in MLCp (A,B,D,E) and tension (C,F). (A) and (D) are representative Western blots. (−): tissues were not exposed to drug; (+): tissues were exposed to drug. Bars are means ± SE, n = 5–11. *P < 0.05, compared with the BayK (−)H-1152, and BayK (+)Ca2+ responses. ψP < 0.05, compared with the basal values (B and C) and compared with BayK (−) 0 Ca2+ (F); anova /Newman-Keuls
Figure 3
Figure 3
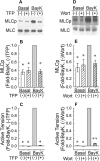
Effects of 50 µM trifluoperazine (TFP, A–C) and 1 µM wortmannin (Wort, D–F) on myosin light chain phosphorylation (MLCp, A,B,D,E) and tension (C,F) in unstimulated muscle (basal) and in tissues stimulated to contraction by addition of 30 nM Bay K 8644 (BayK). (A) and (B) are representative Western blots. (−): tissues were not exposed to drug; (+): tissues were exposed to drug. Bars are means ± SE, n = 7–8. *P < 0.05, compared with BayK (−)TFP, and BayK (−)Wort responses. ψP < 0.05 compared with the basal values; anova /Newman-Keuls.
Figure 5
Figure 5
Effect of 1 µM H-1152 (A–C), 50 µM trifluoperazine (TFP, D–F) and 1 µM Wortmannin (Wort, G–I) on basal and Bay K 8644 (BayK)-induced myosin phosphatase targeting subunit (MYPT1) phosphorylation at T853 and T696 and total MYPT1. (A), (D) and (G) are representative Western blots. (−): tissues were not exposed to drug; (+): tissues were exposed to drug. Bars are mean ± SE, n = 5–9. *P < 0.05, compared with basal (−), and BayK (−) values; anova /Dunnett.
Figure 6
Figure 6
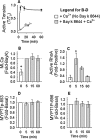
Effects of Ca2+-free solutions. There was considerably less variability in the rate of tension development during a Bay K 8644-induced contraction, when tissues were incubated for 30 min in a Ca2+-free solution in the presence of 100 nM Bay K 8644 plus 10 mM KCl, then activated by adding 2 mM CaCl2, compared with results obtained from tissues activated by adding Bay K 8644 plus 7.5 or 10 mM KCl directly to a Ca2+-containing solution (A, Ca2+, tracing and symbols are average values, symbols reveal ±SE at 5, 15 and 60 min, n = 7). Tissues quick-frozen at 0 (basal, either with Bay K 8644 in 0 Ca2+ or with 2 mM Ca2+ and no Bay K 8644), 5, 15 and 60 min were processed to measure the time course of changes in myosin light chain phosphorylation (MLCp, B), active RhoA (C), myosin phosphatase targeting subunit (MYPT1)-pT853 (D) and MYPT1-pT696 (E). Bars are mean ± SE, n = 5. *P < 0.05, compared with Bay K 8644 + Ca2+ (B) and compared with basal values (C); anova /Newman-Keuls.
Figure 7
Figure 7
Example of 100 nM Bay K 8644 (BayK)-induced tension (A) versus time tracings produced in rabbit femoral artery. Tracing and symbols are average values; symbols reveal ±SE at 5, 15 and 60 min (n = 4). Tissues quick-frozen at 0 (basal), 5, 15 and 60 min were processed to measure the time course of changes in myosin light chain phosphorylation (MLCp, B), active RhoA (C), myosin phosphatase targeting subunit (MYPT1)-pT853 (D) and MYPT1-pT696 (E). Bars are mean ± SE, n = 4. *P < 0.05, compared with Bay K 8644 + Ca2+ (B) and compared with basal values (C); anova /Newman-Keuls.
Figure 1
Figure 1
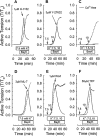
Examples of tension versus time tracings showing control 30 nM Bay K 8644 (BayK)-induced contractions (dashed lines) and the effect of selective inhibitors (A,B,D–F) and a Ca2+-free solution (C) on contractions induced by BayK (solid lines). RhoA kinase inhibitors H-1152 (1 µM, A) and Y-27632 (3 µM, B), myosin light chain kinase inhibitors ML-7 (3 µM, D) and wortmannin (1 µM, E), and the calmodulin inhibitor trifluoperazine (50 µM, F) were added at the times indicated by arrows. 7.5 and 10 refer to the amount (in mM) of KCl (K+) added. Horizontal bars indicate the duration of time tissues were exposed to K+ and BayK.
Figure 9
Figure 9
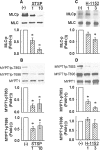
Effect of staurosporine (STSP) and H-1152 on basal myosin light chain phosphorylation (MLCp, A and C respectively) and basal myosin phosphatase targeting subunit (MYPT1) phosphorylation at T853 and T696 and total MYPT1 (B and D respectively). Protein bands are representative Western blots. (−): tissues were not exposed to drug. Bars are means ± SE, n = 4–9. *P < 0.05, compared with (−) values; anova /Dunnett.
Figure 4
Figure 4
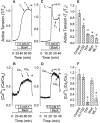
Examples of 30 nM Bay K 8644 (BayK)-induced tension (A,C) and [Ca2+]i (B,D) versus time tracings, and summary tension (E) and [Ca2+]i (F) data produced in the absence of an inhibitor (A and B and ‘Control’ in E and F) and after addition of an inhibitor (C,D and inhibitors in E,F). Inhibitors H-1152, trifluoperazine (TFP), wortmannin (Wort) and ML-7 were added to tissues once contractions achieved a pseudo-steady state [arrows linking H-11 (H-1152) to the tension (C) and [Ca2+]i (D) tracings]. T1 and Ca1 indicate the times at which, respectively, pre-drug tensions and [Ca2+]i values were recorded. T2 and Ca2 indicate the times at which, respectively, post-drug tensions and [Ca2+]i values were recorded. Data in (E) and (F) are means ± SE, n = 3–4. *P < 0.05 compared with control; anova /Dunnett.
Figure 8
Figure 8
Examples (A,B) and summary data (C) of 100 nM Bay K 8644 (BayK)-induced tension versus time tracings produced in the absence of an inhibitor and after addition of an inhibitor in rabbit femoral artery. Inhibitors H-1152 and KT-5720 were added to tissues once contractions achieved a pseudo-steady state. Effect of 1 µM H-1152 (D) and 1 µM KT-5720 (E) on BayK-induced myosin phosphatase targeting subunit (MYPT1) phosphorylation at T853 and T696 and total MYPT1. Effect of 1 µM U-0126 and 1 µM KT-5720 on basal ERK1 and ERK2 phosphorylation (F). (D), (E) and (F) are representative Western blots. (−): tissues were not exposed to drug; (+): tissues were exposed to drug. B, basal; U, U-126 and KT, KT-5720. Bars in (C) are means ± SE, n = 4. *P < 0.05, compared with control (Con) values.

Similar articles

Cited by

References

    1. Asano M, Nomura Y. Comparison of inhibitory effects of Y-27632, a Rho kinase inhibitor, in strips of small and large mesenteric arteries from spontaneously hypertensive and normotensive Wistar-Kyoto rats. Hypertens Res. 2003;26:97–106. - PubMed
    1. Bain J, Plater L, Elliott M, Shpiro N, Hastie CJ, McLauchlan H, et al. The selectivity of protein kinase inhibitors: a further update. Biochem J. 2007;408:297–315. - PMC - PubMed
    1. Brown AM, Kunze DL, Yatani A. The agonist effect of dihydropyridines on Ca channels. Nature. 1984;311:570–572. - PubMed
    1. Brozovich FV. Rho signaling: agonist stimulation and depolarization come together. Circ Res. 2003;93:481–483. - PubMed
    1. Casteels R, Kitamura K, Kuriyama H, Suzuki H. Excitation-contraction coupling in the smooth muscle cells of the rabbit main pulmonary artery. J Physiol. 1977;271:63–79. - PMC - PubMed

Publication types

MeSH terms

Substances