

Limited CD4+ T cell proliferation leads to preservation of CD4+ T cell counts in SIV-infected sooty mangabeys
- PMID: 20591864
- PMCID: PMC2992704
- DOI: 10.1098/rspb.2010.0972
Limited CD4+ T cell proliferation leads to preservation of CD4+ T cell counts in SIV-infected sooty mangabeys
Abstract
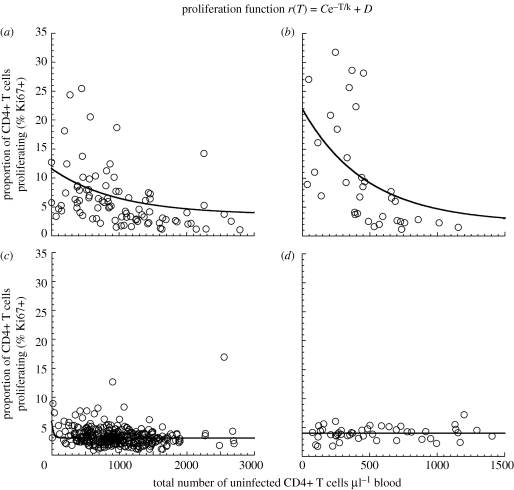
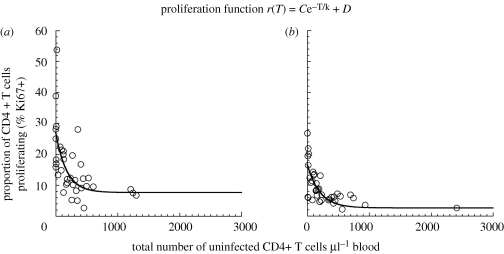
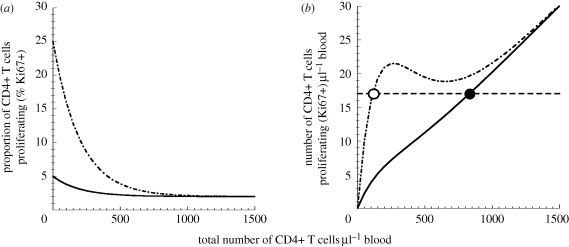
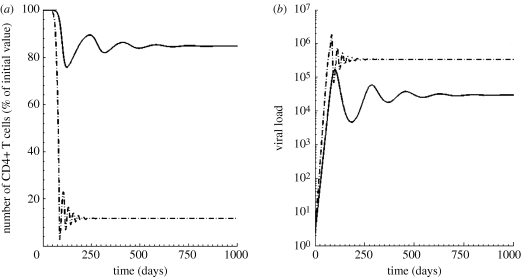
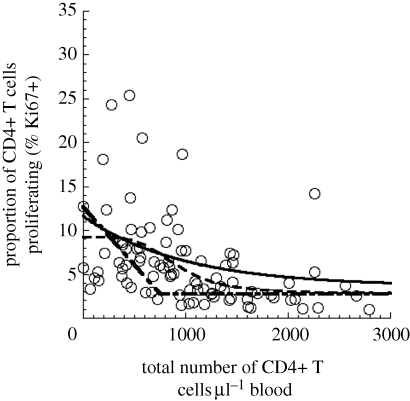
Human immunodeficiency virus (HIV) and simian immunodeficiency virus (SIV) infections result in chronic virus replication and progressive depletion of CD4+ T cells, leading to immunodeficiency and death. In contrast, 'natural hosts' of SIV experience persistent infection with high virus replication but no severe CD4+ T cell depletion, and remain AIDS-free. One important difference between pathogenic and non-pathogenic infections is the level of activation and proliferation of CD4+ T cells. We analysed the relationship between CD4+ T cell number and proliferation in HIV, pathogenic SIV in macaques, and non-pathogenic SIV in sooty mangabeys (SMs) and mandrills. We found that CD4+ T cell proliferation was negatively correlated with CD4+ T cell number, suggesting that animals respond to the loss of CD4+ T cells by increasing the proliferation of remaining cells. However, the level of proliferation seen in pathogenic infections (SIV in rhesus macaques and HIV) was much greater than in non-pathogenic infections (SMs and mandrills). We then used a modelling approach to understand how the host proliferative response to CD4+ T cell depletion may impact the outcome of infection. This modelling demonstrates that the rapid proliferation of CD4+ T cells in humans and macaques associated with low CD4+ T cell levels can act to 'fuel the fire' of infection by providing more proliferating cells for infection. Natural host species, on the other hand, have limited proliferation of CD4+ T cells at low CD4+ T cell levels, which allows them to restrict the number of proliferating cells susceptible to infection.
Figures
Similar articles
-
Increased stability and limited proliferation of CD4+ central memory T cells differentiate nonprogressive simian immunodeficiency virus (SIV) infection of sooty mangabeys from progressive SIV infection of rhesus macaques.J Virol. 2014 Apr;88(8):4533-42. doi: 10.1128/JVI.03515-13. Epub 2014 Feb 5. J Virol. 2014. PMID: 24501416 Free PMC article.
-
Reduced Simian Immunodeficiency Virus Replication in Macrophages of Sooty Mangabeys Is Associated with Increased Expression of Host Restriction Factors.J Virol. 2015 Oct;89(20):10136-44. doi: 10.1128/JVI.00710-15. Epub 2015 Jul 22. J Virol. 2015. PMID: 26202248 Free PMC article.
-
Divergent host responses during primary simian immunodeficiency virus SIVsm infection of natural sooty mangabey and nonnatural rhesus macaque hosts.J Virol. 2005 Apr;79(7):4043-54. doi: 10.1128/JVI.79.7.4043-4054.2005. J Virol. 2005. PMID: 15767406 Free PMC article.
-
Naturally SIV-infected sooty mangabeys: are we closer to understanding why they do not develop AIDS?J Med Primatol. 2005 Oct;34(5-6):243-52. doi: 10.1111/j.1600-0684.2005.00122.x. J Med Primatol. 2005. PMID: 16128919 Review.
-
The Hitchhiker Guide to CD4+ T-Cell Depletion in Lentiviral Infection. A Critical Review of the Dynamics of the CD4+ T Cells in SIV and HIV Infection.Front Immunol. 2021 Jul 21;12:695674. doi: 10.3389/fimmu.2021.695674. eCollection 2021. Front Immunol. 2021. PMID: 34367156 Free PMC article.
Cited by
-
Increased stability and limited proliferation of CD4+ central memory T cells differentiate nonprogressive simian immunodeficiency virus (SIV) infection of sooty mangabeys from progressive SIV infection of rhesus macaques.J Virol. 2014 Apr;88(8):4533-42. doi: 10.1128/JVI.03515-13. Epub 2014 Feb 5. J Virol. 2014. PMID: 24501416 Free PMC article.
-
HIV-1 infection induces interleukin-1β production via TLR8 protein-dependent and NLRP3 inflammasome mechanisms in human monocytes.J Biol Chem. 2014 Aug 1;289(31):21716-26. doi: 10.1074/jbc.M114.566620. Epub 2014 Jun 17. J Biol Chem. 2014. PMID: 24939850 Free PMC article.
-
HCV coinfection contributes to HIV pathogenesis by increasing immune exhaustion in CD8 T-cells.PLoS One. 2017 Mar 21;12(3):e0173943. doi: 10.1371/journal.pone.0173943. eCollection 2017. PLoS One. 2017. PMID: 28323897 Free PMC article.
-
Increased Regulatory T-Cell Activity and Enhanced T-Cell Homeostatic Signaling in Slow Progressing HIV-infected Children.Front Immunol. 2019 Feb 12;10:213. doi: 10.3389/fimmu.2019.00213. eCollection 2019. Front Immunol. 2019. PMID: 30809229 Free PMC article.
-
Short communication: HIV+ viremic slow progressors maintain low regulatory T cell numbers in rectal mucosa but exhibit high T cell activation.AIDS Res Hum Retroviruses. 2013 Jan;29(1):172-7. doi: 10.1089/AID.2012.0268. Epub 2012 Oct 16. AIDS Res Hum Retroviruses. 2013. PMID: 22998457 Free PMC article.
References
-
- Biancotto A., Iglehart S. J., Vanpouille C., Condack C. E., Lisco A., Ruecker E., Hirsch I., Margolis L. B., Grivel J. C.2008HIV-1 induced activation of CD4+ T cells creates new targets for HIV-1 infection in human lymphoid tissue ex vivo. Blood 111, 699–70410.1182/blood-2007-05-088435 (doi:10.1182/blood-2007-05-088435) - DOI - DOI - PMC - PubMed
-
- Brenchley J. M., et al. 2004CD4+ T cell depletion during all stages of HIV disease occurs predominantly in the gastrointestinal tract. J. Exp. Med. 200, 749–75910.1084/jem.20040874 (doi:10.1084/jem.20040874) - DOI - DOI - PMC - PubMed
-
- Brenchley J. M., et al. 2006Microbial translocation is a cause of systemic immune activation in chronic HIV infection. Nat. Med. 12, 1365–137110.1038/nm1511 (doi:10.1038/nm1511) - DOI - DOI - PubMed
-
- Brenchley J. M., et al. 2008Differential Th17 CD4 T-cell depletion in pathogenic and nonpathogenic lentiviral infections. Blood 112, 2826–283510.1182/blood-2008-05-159301 (doi:10.1182/blood-2008-05-159301) - DOI - DOI - PMC - PubMed
-
- Broussard S. R., Staprans S. I., White R., Whitehead E. M., Feinberg M. B., Allan J. S.2001Simian immunodeficiency virus replicates to high levels in naturally infected African green monkeys without inducing immunologic or neurologic disease. J. Virol. 75, 2262–227510.1128/JVI.75.5.2262-2275.2001 (doi:10.1128/JVI.75.5.2262-2275.2001) - DOI - DOI - PMC - PubMed
Publication types
MeSH terms
Substances
Grants and funding
LinkOut - more resources
Full Text Sources
Research Materials
