. 2010 Sep 3;285(36):27982-99.
doi: 10.1074/jbc.M109.095349. Epub 2010 Jun 30.

Analysis of spliceosomal proteins in Trypanosomatids reveals novel functions in mRNA processing

Affiliations

Analysis of spliceosomal proteins in Trypanosomatids reveals novel functions in mRNA processing

Itai Dov Tkacz et al. J Biol Chem. .

Abstract

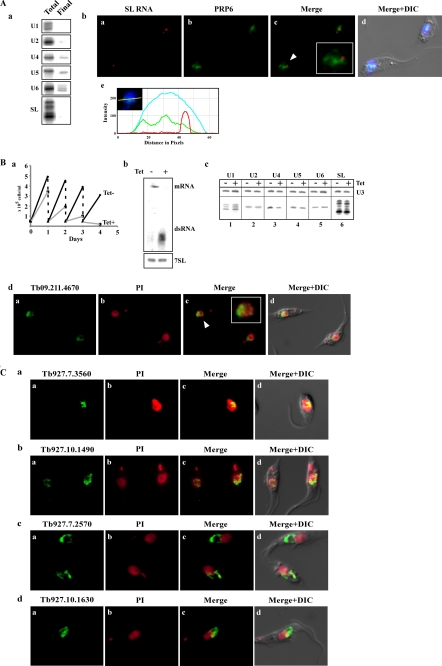
In trypanosomatids, all mRNAs are processed via trans-splicing, although cis-splicing also occurs. In trans-splicing, a common small exon, the spliced leader (SL), which is derived from a small SL RNA species, is added to all mRNAs. Sm and Lsm proteins are core proteins that bind to U snRNAs and are essential for both these splicing processes. In this study, SmD3- and Lsm3-associated complexes were purified to homogeneity from Leishmania tarentolae. The purified complexes were analyzed by mass spectrometry, and 54 and 39 proteins were purified from SmD3 and Lsm complexes, respectively. Interestingly, among the proteins purified from Lsm3, no mRNA degradation factors were detected, as in Lsm complexes from other eukaryotes. The U1A complex was purified and mass spectrometry analysis identified, in addition to U1 small nuclear ribonucleoprotein (snRNP) proteins, additional co-purified proteins, including the polyadenylation factor CPSF73. Defects observed in cells silenced for U1 snRNP proteins suggest that the U1 snRNP functions exclusively in cis-splicing, although U1A also participates in polyadenylation and affects trans-splicing. The study characterized several trypanosome-specific nuclear factors involved in snRNP biogenesis, whose function was elucidated in Trypanosoma brucei. Conserved factors, such as PRP19, which functions at the heart of every cis-spliceosome, also affect SL RNA modification; GEMIN2, a protein associated with SMN (survival of motor neurons) and implicated in selective association of U snRNA with core Sm proteins in trypanosomes, is a master regulator of snRNP assembly. This study demonstrates the existence of trypanosomatid-specific splicing factors but also that conserved snRNP proteins possess trypanosome-specific functions.


Figures

FIGURE 1.
FIGURE 1.
Purification of SmD3 and Lsm3 complexes from L. tarentolae. A, schematic presentation of the vector used to express the SmD3 and Lsm3 proteins. The tag complements, streptavidin-binding domain, tobacco etch virus (TEV) cleavage site, and protein A are indicated. B, Western analysis demonstrating the expression of SmD3- and Lsm3-tagged proteins; proteins were extracted from 107 cells, separated on a 12% SDS-polyacrylamide gel, and subjected to Western analysis by reaction with rabbit IgG (Sigma). C, silver stain of RNA extracted from the purified SmD3 (panel a) and Lsm3 (panel b) particles. Purification was carried out from ∼2 × 10¹¹ cells as described under “Experimental Procedures.” Half of the final material was separated next to total RNA (10 μg) on a 6% denaturing acrylamide gel. The gel was stained with silver. The size markers and the identity of the RNAs are indicated. D, primer extension to identify the content of U snRNA in the purified complexes. SmD3, panel a; Lsm3, panel b. Half of the sample analyzed in C was subjected to primer extension using U snRNA-specific probes, listed in supplemental S-1. E, protein composition of the SmD3 (panel a), and Lsm3 (panel b) complexes. Purification was performed using ∼2 × 10¹¹ cells, as described under “Experimental Procedures.” The purified proteins were separated on a 12% SDS-polyacrylamide gel and stained with silver. The molecular mass markers are indicated.
FIGURE 2.
FIGURE 2.
U1 70-kDa silencing destabilizes the level of U1 snRNA and inhibits cis- but not trans-splicing. A, growth curves of T. brucei cells silenced for the U1 70 kDa. Growth of uninduced cells was compared with growth after tetracycline addition. Both uninduced and induced cultures were diluted daily to 2 × 10⁴ cells per ml. B, Northern blot analysis of the U1 70-kDa gene. RNA was prepared from uninduced cells (−Tet) and from cells after 2 days of induction (+Tet). Total RNA (20 μg) was subjected to Northern analysis with randomly labeled probes. The transcript of the U1 70 kDa and the dsRNA are shown, as well as 7SL RNA, which was used to control for equal loading. C, silencing of the U1 70 kDa specifically destabilized the level of U1 snRNA. Total RNA was extracted from uninduced cells or after 2 days of induction. The level of the U snRNAs was determined by primer extension, and the degree of reduction was determined by phosphorimaging. D, effect of U1 70-kDa silencing on cis-splicing. cDNA was prepared from the RNA extracted from uninduced cells (−Tet) or after 2 days of induction (+Tet). The cDNA was subjected to PCR with oligonucleotides specific to mature or pre-PAP transcript, as described under “Experimental Procedures.” The level of 7SL RNA was used to control for equal amounts of cDNA. E, panel a, reduction in the level of U1 70 kDa during silencing of gene expression. Proteins from cells (107) after 2–5 days of silencing were separated on a 10% SDS-polyacrylamide gel and subjected to Western analysis with anti-U1 70-kDa antibodies prepared as described under “Experimental Procedures.” An additional aliquot of tetracycline was added after 3 days to induce maximum silencing. Reactivity with PTB1 antibodies (59) was used as a control for equal loading. Panel b, trans-splicing during U1 70-kDa silencing. Total RNA (10 μg) from the same cells as described in panel a was subjected to primer extension with an oligonucleotide complementary to the intron region of SL RNA (supplemental S-1). Primer extension of U3 snoRNA was used to control for the level of the RNA in the samples. The products were separated on a 6% acrylamide denaturing gel. The results were subjected to phosphorimaging, and quantitation was performed using ImageJ. The levels of SL RNA and Y structure are given as fold change with respect to the amount present at day 0 and were normalized to the level of U3 snoRNA. Panel c, changes in the level of tubulin precursor during silencing of the U1 70 kDa. Total RNA (20 μg), from the cells described in panels a and b, was subjected to Northern analysis with antisense tubulin RNA probe. The blot was hybridized with random-labeled 7SL RNA probe to control for equal loading.
FIGURE 3.
FIGURE 3.
Effect of silencing the U1 24-kDa coding gene. A, growth curves of T. brucei cells silenced for the U1 24 kDa. Growth of uninduced cells was compared with growth after tetracycline addition. Both uninduced and induced cultures were diluted daily to 1 × 10⁵ cells per ml. B, Northern blot analysis of the U1 24-kDa protein. RNA was prepared from uninduced cells (−Tet) and cells after 2 days of induction (+Tet). Total RNA (20 μg) was subjected to Northern analysis with randomly labeled probes. Blot shows the transcript of the U1 24-kDa gene and the dsRNA, as well as 7SL RNA, which was used to control for equal loading. C, silencing of the U1 24 kDa slightly reduced the level of U1 snRNA. Total RNA (10 μg) was prepared from cells carrying the silencing construct uninduced (−Tet) or after 2 days of induction (+Tet) and was subjected to primer extension with U1-specific oligonucleotide, and the change in the level was determined by phosphorimaging. The level of U3 snoRNA was used to control for equal loading. D, effect of U1 24-kDa silencing on trans-splicing. Panel a, effect on the formation of the Y structure intermediate. Total RNA (10 μg) was prepared from cells carrying the silencing construct uninduced (−Tet) or after 2 days of induction (+Tet) and was subjected to primer extension with oligonucleotide complementary to the intron region of SL RNA (supplemental S-1). The products were separated on a 6% denaturing gel. The level of U3 snRNA was used to control for equal loading. Panel b, effect of U1 24-kDa silencing on SL RNA capping. RNA, as in panel a, was subjected to primer extension with oligonucleotide complementary to SL RNA (supplemental S-1). The RNA was separated on a 6% denaturing gel. The position of the capped nts is indicated. E, effect of U1 24-kDa silencing on cis-splicing. cDNA was prepared from RNA extracted from uninduced cells (−Tet) or after 2 days of induction (+Tet). The cDNA was subjected to PCR with oligonucleotide specific to mature or to pre-PAP transcript, as described under “Experimental Procedures.” The level of 7SL RNA was used to control for equal amounts of cDNA.
FIGURE 4.
FIGURE 4.
RNAi silencing of U1A suggests its function in both trans- and cis-splicing. A, growth curves of T. brucei cells silenced for U1A. Growth of uninduced cells was compared with growth after tetracycline addition. Both uninduced and induced cultures were diluted daily to 5 × 10⁴ cells per ml. B, Northern blot analysis. RNA was prepared from uninduced cells (−Tet) and cells after 2 days of induction (+Tet). Total RNA (20 μg) was subjected to Northern analysis with randomly labeled probes. The transcript of the U1A and the dsRNA as well as 7SL RNA that was used to control for equal loading are indicated. C, silencing of U1A has no effect on the level of U1 snRNA. Total RNA was extracted from uninduced cells or after 2 days of induction, and 10 μg was used to determine the level of the U1 snRNA by primer extension. The level of U3 was used to control for equal loading. D, cis-splicing of PAP in U1A silenced cells. RNA was prepared from uninduced cells or after 2 days of induction. cDNA was prepared and subjected to PCR amplification with oligonucleotide specific to mature or pre-PAP transcript, as described under “Experimental Procedures.” The level of 7SL RNA was used to control for equal amounts of cDNA. E, panel a, effect of U1 silencing on the level of U1A protein. Cells expressing PTP-U1A and the U1A silencing construct were silenced for the number of days indicated. Proteins from cells (107) after 2–5 days of silencing were separated on a 10% SDS-polyacrylamide gel and subjected to Western analysis as described under “Experimental Procedures.” Reactivity with PTB1 antibodies was used as a control for equal loading. Panel b, U1A silencing affects trans-splicing. Total RNA (10 μg) from the same cells as described in panel a was subjected to primer extension with an oligonucleotide complementary to the intron region of SL RNA (supplemental S-1). Primer extension of U3 was used to determine the RNA used. The products were separated on a 6% acrylamide denaturing gel. The results were subjected to phosphorimaging and quantitation using ImageJ. The levels of SL RNA and Y structure are given as fold change with respect to the amount present at day 0 and were normalized to the level of U3 snoRNA. Panel c, changes in the level of tubulin precursor during silencing of U1A. Total RNA (20 μg) from the cells described in panels a and b was subjected to Northern analysis with antisense tubulin RNA probe. The blot was hybridized with random-labeled 7SL RNA probe to control for equal loading. F, localization of U1A with respect to SL RNA. In situ hybridization combined with immunofluorescence was performed as described under “Experimental Procedures.” Panel a, in situ hybridization with SL RNA; panel b, immunofluorescence of PTP-tagged U1A; panel c, merge of panels a and b; panel d, DIC and DAPI-stained nuclei merge with panel c. Panel e, fluorescence emissions at 445–450 nm (blue, DAPI), 525–550 nm (green, the FITC bound to antibody), and 650–690 nm (red, SL RNA, Alexa fluor 647) were examined in the area surrounding the line (inset). The intensity of the different chromophores is plotted, demonstrating overlap between the SL RNA, U1A, and the nucleus signals.
FIGURE 5.
FIGURE 5.
Purification of U1A-associated proteins. A, protein composition of the U1A complex. Purification was performed using ∼2 × 10¹¹ cells, as described under “Experimental Procedures.” The purified proteins were separated on a 12% SDS-polyacrylamide gel and stained with silver. The molecular mass markers are indicated. B, specificity of snRNA selection using the U1A-tagged protein. Extract was prepared from cells as described (13). RNA was extracted from IgG-agarose beads and subjected to primer extension with the different probes (supplemental S-1). RNA was prepared from an aliquot of cells before selection (Total), and RNA from the beads (Final). Only an aliquot (2%) of the sample was analyzed from the total RNA, whereas the entire sample from the beads was analyzed. C, U1A functions in polyadenylation. Panel a, changes in poly(A) tail during U1A silencing. Cell expressing silencing constructs for either PAP,4 U1 70 kDa, and U1A were silenced. RNA was prepared from uninduced cells (−) or after 2 days of silencing (+). RNA was splint-labeled, digested with RNase A and T1, and the labeled tails were separated on a 15% denaturing gel next to a pBR322 DNA-MspI digest. The level of U3 snoRNA was used to determine the amount of RNA in each sample. Panel b, quantitation of the poly(A) tail length. The phosphorimages were scanned, and the intensity of the signals was measured and plotted. The black and gray histograms represent the tail length distributions of uninduced and induced cells, respectively. D, fractionation of U1 snRNP-associated proteins. Whole cell extracts were prepared from 5 × 10⁸ cells and layered on continuous 10–30% (w/v) sucrose gradient in buffer A containing 150 mm KCl. Gradients were centrifuged at 4 °C for 3 h at 35,000 rpm in a Beckman SW41 rotor. S values were determined using the following standards: 30 S, 50 S, and 70 S E. coli ribosomes and the enzyme, catalase (10 S). Following centrifugation, 24 fractions were collected, and RNA and protein samples were prepared after ethanol precipitation. The proteins were subjected to Western analysis with anti-U1 70-kDa antibodies that recognize the PTP-tagged U1A and the U1 70 kDa. U1 snRNA level was determined by primer extension.
FIGURE 6.
FIGURE 6.
PRP19 is essential for trans-splicing and is localized in the SL RNP factory. A, growth curves of T. brucei cells silenced for PRP19 homologue. Growth of uninduced cells was compared with growth after tetracycline addition. Both uninduced and induced cultures were diluted daily to 5 × 10⁵ cells per ml. B, Northern blot analysis of the prp19 gene. RNA was prepared from uninduced cells (−Tet) and cells after 2 days of induction (+Tet). Total RNA (20 μg) was subjected to Northern analysis with randomly labeled probes. The transcript of PRP19, dsRNA, as well as 7SL RNA that was used to control for equal loading are indicated. C, silencing of PRP19 affects cis-splicing. RNA was prepared from uninduced cells or after 2 days of induction. cDNA was prepared and subjected to PCR amplification with oligonucleotide specific to mature or pre-PAP transcript, as described under “Experimental Procedures.” The level of 7SL RNA was used to control for equal amounts of cDNA. D, silencing of PRP19 affects trans-splicing and SL RNA capping. Panel a, total RNA was extracted from uninduced cells or after 2 days of induction and was subjected to primer extension with oligonucleotide complementary to the intron region of SL RNA (supplemental S-1). The products were separated on a 6% acrylamide denaturing gel. The level of U3 snoRNA was used as a control for equal loading. Panel b, capping of SL RNA is perturbed in PRP19 silenced cells. RNA as in panel a was subjected to primer extension with oligonucleotide complementary to SL RNA (supplemental S-1), and extension products were separated next to the DNA sequence of the SL RNA gene. The positions of the cap nts are indicated. E, localization of PRP19. Transgenic cells for tSNAP42-CFP and YFP-PRP19 were stained with Hoechst. Panels b and c depict an enlargement of the cell located in the left side, and panels d and e show an enlargement of the cell on the right side. The cells were visualized as described under “Experimental Procedures.” Fluorescence image stacks were deconvoluted and rendered as an isosurface model showing overlapping signals tSNAP42 and PRP19. The Hoechst stain is shown in red.
FIGURE 7.
FIGURE 7.
GEMIN2 exists in the SL RNP factory and directly and indirectly controls the level of snRNAs. A, RNAi silencing of GEMIN2. Panel a, growth curves of T. brucei cells silenced for the GEMIN2 homologue. Growth of uninduced cells was compared with growth after tetracycline addition. Both uninduced and induced cultures were diluted daily to 5 × 10⁴ cells/ml. Panel b, Northern blot analysis of the GEMIN2 gene. RNA was prepared from uninduced cells (−Tet) and cells after 2 days of induction (+Tet). Total RNA (20 μg) was subjected to Northern analysis with randomly labeled probes. The transcripts of GEMIN2, dsRNA, as well as 7SL RNA that was used to control for equal loading are indicated. B, level of U snRNAs upon GEMIN2 silencing. Total RNA was extracted from uninduced cells or after 2 days of induction. The level of the U snRNAs was determined by primer extension using specific oligonucleotide, as listed in supplemental S-1. U3 level was used as a control for equal loading. C, silencing of GEMIN2 affects cis-splicing. RNA was prepared from uninduced cells or after 2 days of induction. cDNA was prepared and subjected to PCR amplification with oligonucleotide specific to mature or pre-PAP transcript, as described under “Experimental Procedures.” The level of 7SL RNA was used to control for equal amounts of cDNA. D, localization of GEMIN2 with respect to SL RNA. In situ hybridization combined with immunofluorescence was performed as described under “Experimental Procedures.” Panel a, in situ hybridization with SL RNA; panel b, immunofluorescence of PTP-tagged GEMIN2; panel c, merge of panels a and b; panel d, DIC and DAPI-stained nuclei merge with panel c. Panel e, fluorescence emissions at 445–450 nm (blue, DAPI), 525–550 nm (green, the FITC bound to antibody), and 650–690 nm (red, SL RNA, Alexa Fluor 647) were examined in the area surrounding the line (inset). The intensity of the different chromophores is plotted, demonstrating overlap between the SL RNA, GEMIN2, and the nucleus signals.
FIGURE 8.
FIGURE 8.
Localization of splicing factors co-purifying with SmD3 complex. A, PRP6. Panel a, PRP6 is associated with U5 but also with U4 and U6 snRNPs. Extract was prepared from cells as described (13). RNA was extracted from IgG-agarose beads and subjected to primer extension with the different probes (supplemental S-1). RNA was prepared from an aliquot of cells before selection (Total), and RNA from the beads (Final). Only an aliquot (2%) of the total RNA sample was analyzed, whereas the entire sample from the beads was analyzed. Panel b, localization of PRP6 with respect to SL RNA. In situ hybridization combined with immunofluorescence was performed as described under “Experimental Procedures.” Panel a, in situ hybridization with SL RNA; panel b, immunofluorescence of PTP-tagged PRP6; panel c, merge of panels a and b; panel d, DIC and DAPI-stained nuclei merge with panel c; panel e, intensity plot of the three chromophores under the line (inset) as described in Fig. 7D, panel e, demonstrating no significant overlap between the SL RNA and PRP6. B, gene coding for Tb09.211.4670 is essential and its silencing affects the level of U4 and U5 snRNAs. Panel a, growth curves of T. brucei cells silenced for the factor. Growth of uninduced cells was compared with growth after tetracycline addition. Both uninduced and induced cultures were diluted daily to 5 × 10⁴ cells per ml. Panel b, Northern blot analysis demonstrating the silencing of Tb09.211.4670. RNA was prepared from uninduced cells (−Tet) and cells after 2 days of induction (+Tet). Total RNA (20 μg) was subjected to Northern analysis with randomly labeled probes. The transcripts of the gene, dsRNA as well as 7SL RNA, that were used to control for equal loading are indicated. Panel c, level of U snRNAs upon silencing. Total RNA as was extracted from uninduced cells or after 2 days of induction. The level of the U snRNAs was determined by primer extension using specific oligonucleotides as listed in supplemental S-1. U3 snoRNA level was used as a control for equal loading. Panel d, localization of the protein encoded by Tb09.211.4670. The factor was PTP-tagged, and the expression was detected by immunofluorescence. Panel a, immunofluorescence of PTP-tagged factor; panel b, propidium iodide-stained nuclei; panel c, merging of panels a and b; panel d, DIC merged with panel c. C, localization of the factors associated with SmD3. The details are the same as described in B, panel d, identity of each gene is indicated.

Similar articles

Cited by

References

    1. Brow D. A. (2002) Annu. Rev. Genet. 36, 333–360 - PubMed
    1. Abelson J. (2008) Nat. Struct. Mol. Biol. 15, 1235–1237 - PubMed
    1. Rappsilber J., Ryder U., Lamond A. I., Mann M. (2002) Genome Res. 12, 1231–1245 - PMC - PubMed
    1. Makarov E. M., Makarova O. V., Urlaub H., Gentzel M., Will C. L., Wilm M., Lührmann R. (2002) Science 298, 2205–2208 - PubMed
    1. Liang X. H., Haritan A., Uliel S., Michaeli S. (2003) Eukaryot. Cell 2, 830–840 - PMC - PubMed

Publication types

LinkOut - more resources