. 2010 Sep;154(1):121-33.
doi: 10.1104/pp.110.155242. Epub 2010 Jun 30.

Imaging cell wall architecture in single Zinnia elegans tracheary elements

Affiliations

Imaging cell wall architecture in single Zinnia elegans tracheary elements

Catherine I Lacayo et al. Plant Physiol. 2010 Sep.

Abstract

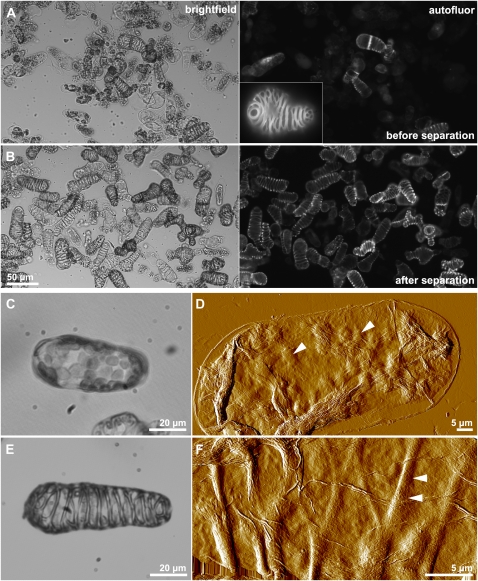
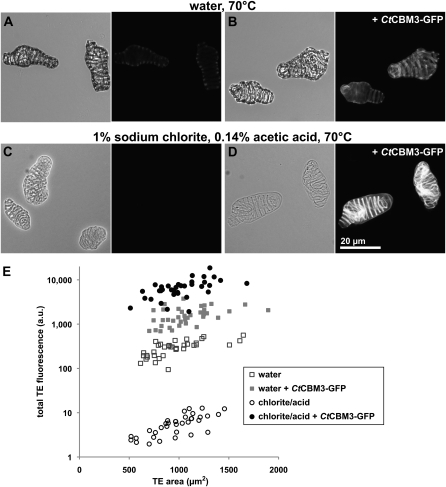
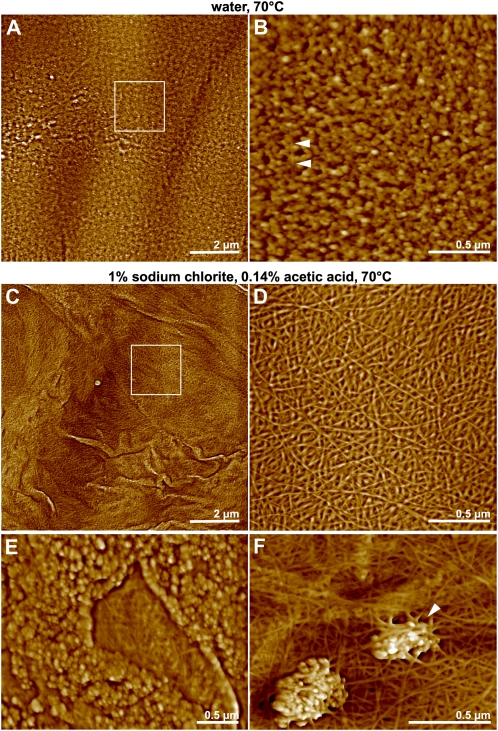
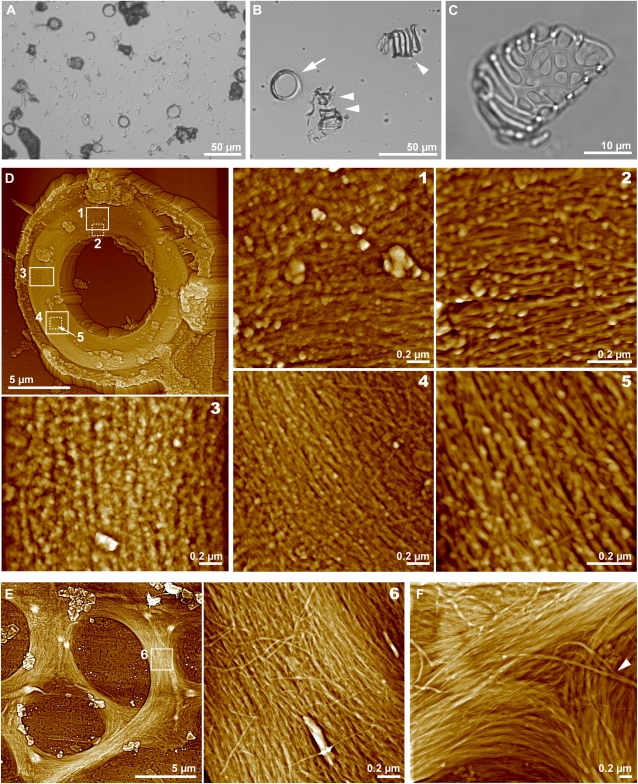
The chemical and structural organization of the plant cell wall was examined in Zinnia elegans tracheary elements (TEs), which specialize by developing prominent secondary wall thickenings underlying the primary wall during xylogenesis in vitro. Three imaging platforms were used in conjunction with chemical extraction of wall components to investigate the composition and structure of single Zinnia TEs. Using fluorescence microscopy with a green fluorescent protein-tagged Clostridium thermocellum family 3 carbohydrate-binding module specific for crystalline cellulose, we found that cellulose accessibility and binding in TEs increased significantly following an acidified chlorite treatment. Examination of chemical composition by synchrotron radiation-based Fourier-transform infrared spectromicroscopy indicated a loss of lignin and a modest loss of other polysaccharides in treated TEs. Atomic force microscopy was used to extensively characterize the topography of cell wall surfaces in TEs, revealing an outer granular matrix covering the underlying meshwork of cellulose fibrils. The internal organization of TEs was determined using secondary wall fragments generated by sonication. Atomic force microscopy revealed that the resulting rings, spirals, and reticulate structures were composed of fibrils arranged in parallel. Based on these combined results, we generated an architectural model of Zinnia TEs composed of three layers: an outermost granular layer, a middle primary wall composed of a meshwork of cellulose fibrils, and inner secondary wall thickenings containing parallel cellulose fibrils. In addition to insights in plant biology, studies using Zinnia TEs could prove especially productive in assessing cell wall responses to enzymatic and microbial degradation, thus aiding current efforts in lignocellulosic biofuel production.


Figures

Figure 1.
Figure 1.
Separation of differentiated TEs from mesophyll cells. A and B, Bright-field (left) and fluorescence (right) image pairs are shown. Autofluorescence (450–490 nm), which mainly originates from lignin in secondary wall thickenings in TEs, is shown. A, Transdifferentiation of cultured Zinnia mesophyll cells into TEs results in a combination of TEs, mesophyll, and dead cells. The inset shows the detail of a mature TE of approximately 50 μm in length with a secondary wall patterned in a reticulate network. B, Separation using density gradient centrifugation generates fractions highly enriched in TEs. C and E, Bright-field images. D and F, AFM images: fast-Z for D and amplitude for F. For AFM, cells were dried on the substrate and thus appear flattened with their contents bulging out. C and D, Mesophyll cells possess chloroplasts and other organelles evident by both light microscopy and AFM. Arrowheads point to the locations of chloroplasts (D). E and F, TEs can be distinguished by the presence of prominent secondary wall thickenings, which are arranged in spiral in the particular example shown. Arrowheads point to the locations of secondary cell wall thickenings (F).
Figure 2.
Figure 2.
CBM3 labeling of TEs after oxidative treatment. A to D, Representative bright-field and fluorescence image pairs are shown. A and B, TEs incubated in water at 70°C for 20 h. C and D, TEs incubated in 1% sodium chlorite, 0.14% acetic acid at 70°C for 20 h. A and C, Unlabeled TEs. B and D, TEs labeled with CtCBM3-GFP, a fluorescently labeled family 3 carbohydrate-binding module that binds to cellulose. A, Unlabeled TEs exhibit a low level of autofluorescence between 512 and 542 nm after incubation in water at 70°C. For presentation purposes, all fluorescent images were scaled consistently so that this panel had a low yet noticeable signal level. B, TEs incubated in water are, on average, approximately 5-fold more fluorescent after labeling with CtCBM3-GFP. C, TEs treated with acidified chlorite show a dramatic loss of autofluorescence. D, TEs treated with acidified chlorite and labeled with CtCBM3-GFP have the highest fluorescence of all the samples analyzed. E, The total fluorescence of single TEs is plotted on a log scale as a function of area. For each population, at least 35 TEs were analyzed. The fluorescence of unlabeled TEs after acidified chlorite treatment (white circles) is comparable with background levels. The largest increase in fluorescence (on average, approximately 1,000-fold) is evident in the population of TEs treated with acidified chlorite and labeled with CtCBM3-GFP (black circles). When compared by Kruskal-Wallis test, all populations were significantly different (P < 0.0001).
Figure 3.
Figure 3.
The topography of TE cell walls revealed by AFM. Contrast-enhanced AFM height images are shown. A and B, Representative images of the surface of TEs incubated in water at 70°C for 20 h show a fairly uniform outer layer of granular material. B, Zoomed image corresponding to the box in A displays granules ranging in size between approximately 20 and 50 nm. Some fibers can be observed embedded within this granular matrix (arrowheads). C to F, Images of TEs after incubation with acidified chlorite at 70°C for 20 h. C and D, In most cases, the surfaces of TEs appear stripped of the granular matrix observed in TEs incubated in water (A and B), and a meshwork of fibrils is exposed. D, Zoomed image corresponding to the box in C shows fibrils. Cellulose fibrils range in width between approximately 8 and 15 nm. E and F, In some cases, the granular matrix covering the surface of TEs is partially resistant to removal by acidified chlorite treatment. E, The underlying meshwork of fibrils is evident through a hole in the outermost granular layer. F, Clumps of granules can also appear embedded within fibrils. Some fibrils appear to run over and through these granular clumps (arrowhead).
Figure 4.
Figure 4.
Chemical composition of TEs characterized by high-resolution SR-FTIR spectromicroscopy. A to C, Bright-field images (at left) and pseudocolored heat maps (right) corresponding to absorbances at the specified wave numbers from representative TEs are shown. Bright-field images were acquired through an infrared objective. Heat maps are normalized to the maximum absorbance of a TE incubated in water at 25°C for 20 h (A) at the corresponding wave number; red corresponds to a ratio of 1.0, while blue corresponds to 0 (see heat scale bar). A, TEs incubated in water at 25°C show a considerable amount of signal intensity from general cell wall components and, more specifically, from cellulosic, hemicellulosic, and pectic materials. A large amount of lignin is also evident as a high signal at approximately 1,510 cm−1. B, Incubation in water at 70°C for 20 h results in the loss of some signal at approximately 1,738 cm−1 and approximately 1,040 cm−1, which correspond to hemicellulosic and pectic material. C, Incubation in acidified chlorite at 70°C for 20 h results in dramatic loss of signal from lignin at approximately 1,510 cm−1. Hemicellulosic and pectic materials also appear to be lost after this treatment. D, Average absorbance values plotted for five randomly chosen TEs are shown for the conditions in A in green, B in blue, and C in red. Wave numbers corresponding to the chemical components shown in A to C are labeled. The broad peak near 3,400 cm−1 mostly corresponds to hydroxyl groups in the cell wall as well as water inside the TEs. E, PCA-LDA was performed on the infrared spectra from the same five randomly chosen TEs. PC scores along the first two modes of variation are plotted for each condition. Confidence intervals at α = 0.05 for all three populations are drawn as ellipses. PCA-LDA separates the population of TEs treated with acidified chlorite from the TEs incubated in water at 25°C or 70°C based on their infrared spectral signatures.
Figure 5.
Figure 5.
TE fragments reveal secondary wall structure. A and B, Bright-field images. C, Differential interference contrast image. A, An overview of TEs after mild sonication is shown. Different types of TE fragments as well as seemingly intact TEs were observed. B, Ring-like structures (arrow) and spirals (arrowhead) from secondary wall thickenings, as well as smaller fragments and cell debris (two arrowheads), are shown following density separation by centrifugation. C, Fragments from reticulate secondary wall networks were also observed. D to F, AFM images of a secondary wall ring (D) and a reticulate network (E and F) are labeled with regions corresponding to the numbered zoomed images. AFM height images were contrast enhanced for presentation. D, The secondary wall ring shown represents a transverse cross-section of a TE. An outermost layer of granular material covers the secondary wall thickening. Regions 1 to 5 depict primarily cellulose fibrils that are arranged in parallel and concentrically and a granular matrix within the ring. In some cases, the observed granules appear to be aggregated into larger structures (region 1) and some fibers appear to run across the main orientation of the cellulose fibrils (regions 4 and 5). E and F, Images correspond to a secondary wall fragment of a reticulate network similar to that shown in C. Acidified chlorite treatment removes the granular material and reveals that fibrils are arranged mostly parallel to the length of thickenings. Some debris, which did not affect imaging, is apparent (E). Several fibrils appear to run across the main orientation of the cellulose fibrils (region 6). F, Fibrils change orientation in large groups at intersecting points on a secondary wall network. Fibrils can also become bundled to form thicker cellulose structures (arrowhead).
Figure 6.
Figure 6.
Model of the cell wall architecture of a single Zinnia TE. The three observed layers of the cell wall are depicted: (1) an outermost granular matrix enveloping the TE; (2) the primary cell wall composed of cellulose microfibrils organized in a meshwork; and (3) the inner secondary cell wall thickenings containing mainly cellulose microfibrils arranged in a parallel orientation. Cellulose microfibrils within the native cell wall are embedded within a granular matrix, which is not depicted for presentation purposes. The cellulose microfibrils and outermost granular layer are not shown to scale.

Similar articles

Cited by

References

    1. Barceló AR. (1995) Peroxidase and not laccase is the enzyme responsible for cell-wall lignification in the secondary thickening of xylem vessels in Lupinus. Protoplasma 186: 41–44
    1. Benova-Kakosova A, Digonnet C, Goubet F, Ranocha P, Jauneau A, Pesquet E, Barbier O, Zhang Z, Capek P, Dupree P, et al. (2006) Galactoglucomannans increase cell population density and alter the protoxylem/metaxylem tracheary element ratio in xylogenic cultures of Zinnia. Plant Physiol 142: 696–709 - PMC - PubMed
    1. Bierhorst DW. (1960) Observations on tracheary elements. Phytomorphology 10: 249–305
    1. Burgess J, Linstead P. (1984) In-vitro tracheary element formation: structural studies and the effect of tri-iodobenzoic acid. Planta 160: 481–489 - PubMed
    1. Carpita NC, Defernez M, Findlay K, Wells B, Shoue DA, Catchpole G, Wilson RH, McCann MC. (2001) Cell wall architecture of the elongating maize coleoptile. Plant Physiol 127: 551–565 - PMC - PubMed

Publication types

MeSH terms