. 2010 Aug;24(8):1605-14.
doi: 10.1210/me.2010-0120. Epub 2010 Jun 30.

Glucagon deficiency reduces hepatic glucose production and improves glucose tolerance in adult mice

Affiliations

Glucagon deficiency reduces hepatic glucose production and improves glucose tolerance in adult mice

Aidan S Hancock et al. Mol Endocrinol. 2010 Aug.

Erratum in

  • Mol Endocrinol. 2010 Oct;24(10):2072

Abstract

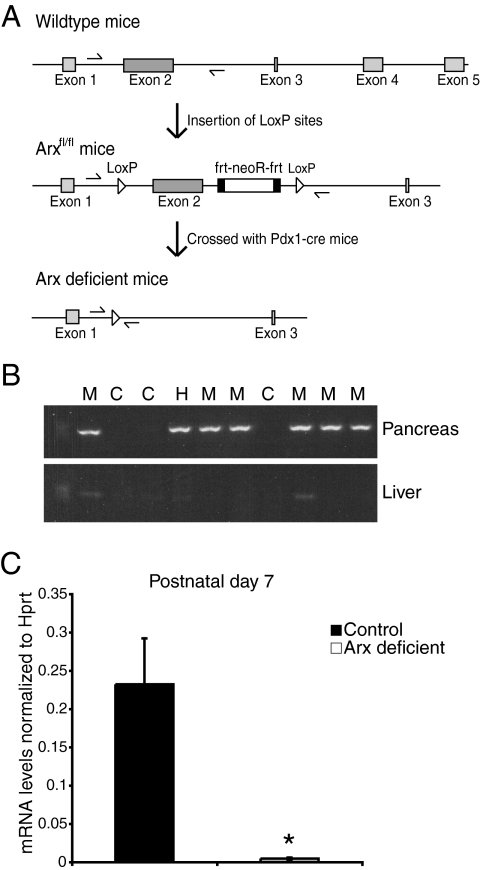
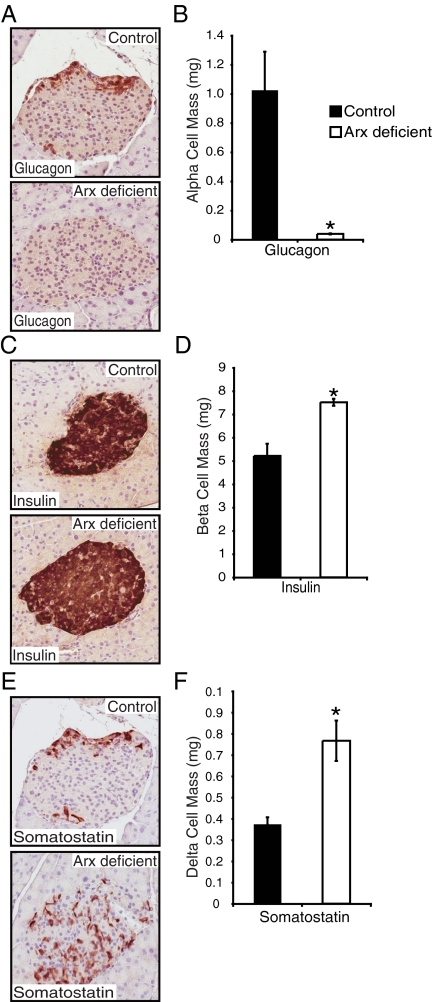
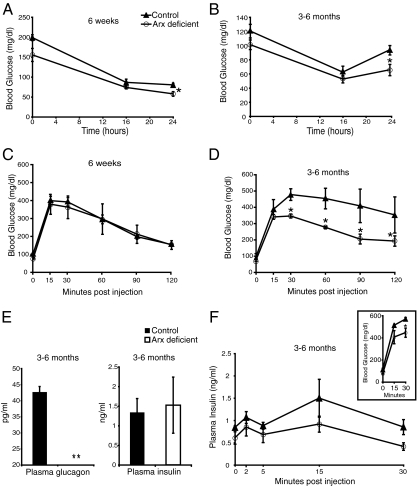
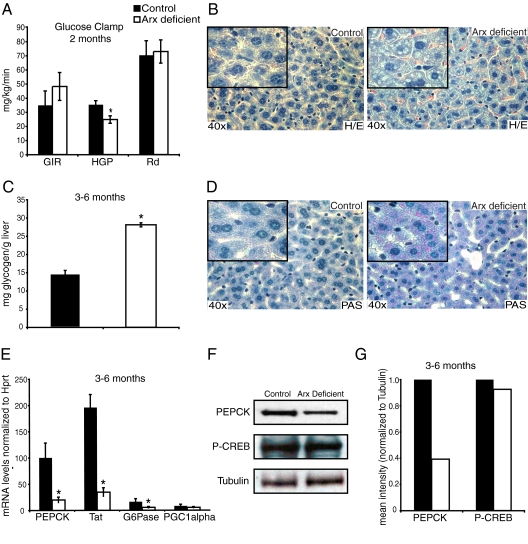
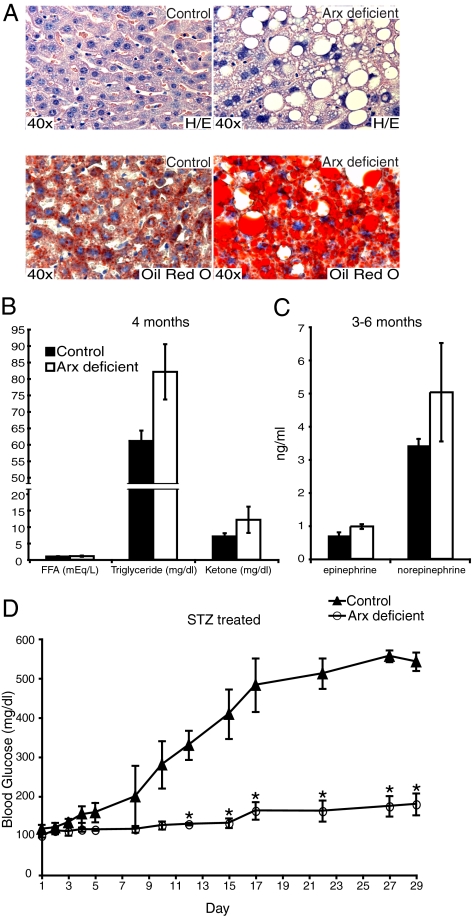
The major role of glucagon is to promote hepatic gluconeogenesis and glycogenolysis to raise blood glucose levels during hypoglycemic conditions. Several animal models have been established to examine the in vivo function of glucagon in the liver through attenuation of glucagon via glucagon receptor knockout animals and pharmacological interventions. To investigate the consequences of glucagon loss to hepatic glucose production and glucose homeostasis, we derived mice with a pancreas specific ablation of the alpha-cell transcription factor, Arx, resulting in a complete loss of the glucagon-producing pancreatic alpha-cell. Using this model, we found that glucagon is not required for the general health of mice but is essential for total hepatic glucose production. Our data clarifies the importance of glucagon during the regulation of fasting and postprandial glucose homeostasis.


Figures

Figure 1
Figure 1
Pdx1-Cre drives pancreas-specific deletion of the Arx gene. A, Representation of wild-type gene sequence (top) and the insertion of the LoxP sites flanking the exon 2 of the Arx gene (middle). Removal of exon 2 after crossing the Arxfl/fl mice with Pdx1-Cre mice (bottom). B, PCR analysis from genomic DNA obtained from pancreas and liver of P2 control (C), heterozygote (H), and Arx-deficient mutant (M) animals. Presence of the PCR product (402 bp) indicates efficient ablation of the Arx gene in the pancreas but not in the liver. Arrows in A indicate the location of the primers used. C, Real-time PCR analysis of Arx mRNA levels in P7 control and mutant pancreas. Values are mean ± sem from three mice per group. *, P < 0.05.
Figure 2
Figure 2
Arx-deficient mice lack glucagon-producing cells. A, C, and E, Immunostaining of glucagon, insulin, and somatostatin in 3- to 6-month-old control and Arx-deficient pancreas. Morphometric analysis indicated 99% reduction in the α-cell mass (B), 1.5-fold increase in the β-cell mass (D), and 2-fold increase in the δ-cell mass (F) in the Arx-deficient animals. Values are mean ± sem from three mice per group. *, P < 0.05 between genotypes.
Figure 3
Figure 3
Arx-deficient mice have no obvious abnormalities and exhibit improved glucose tolerance with age. A, Blood glucose levels of 6-wk-old male mice after 0-, 16-, or 24-h fast. Values are mean ± sem from at least three mice per group. *, P < 0.05 between genotypes. B, Blood glucose levels of 3- to 6-month-old male mice after 0-, 16-, or 24-h fast. Values are mean ± sem from at least three mice per group. *, P < 0.05 between genotypes. C and D, GTT test of 6-wk-old (C) and 3- to -6-month-old (D) male control and Arx-deficient mice. Values are mean ± sem from at least three mice per group. *, P < 0.05 between genotypes. E, Plasma glucagon and insulin levels of 3- to 6-month-old male mice after a 16-h fast. Values are mean ± sem from four mice per group. *, P < 0.05 and between genotypes; **, P < 0.01 between genotypes. Plasma glucagon levels fell below detection threshold (20 pg/ml) for Arx-deficient animals. F, Plasma insulin levels of 3- to 6-month-old male control and Arx-deficient animals was measured during GTT (see inset). Values are mean ± sem from at least three mice per group. *, P < 0.05 between genotypes.
Figure 4
Figure 4
Arx-deficient mice exhibit increased fat and glycogen in the liver. A, GIR HGP, and Rd were measured during the clamp from 2-month-old male control and Arx-deficient mice. Values are mean ± sem from five mice per group. *, P < 0.05 between genotypes. B, Liver histology of 3- to 6-month-old male control and Arx-deficient paraffin-embedded liver sections stained with H&E or (D) Periodic acid-Schiff (PAS) (magnification, ×40). An enlarged portion of the image is provided in the box. C, Glycogen levels were measured in liver taken from mice at 3–6 months of age after a 16-h fast. Values are mean ± sem from three mice per group. *, P < 0.05 between genotypes. E, Real-time PCR analysis measured relative mRNA levels of genes involved in gluconeogenesis from 3- to 6-month-old male after a 16-h fast. Tat, Tyrosine amino transferase. Values are mean ± sem from four mice per group. *, P < 0.05 between genotypes. F, Western blot analysis using liver samples of 3- to 6-month-old male control and Arx-deficient animals to detect PEPCK (63 kDa), P-CREB (43 kDa), and tubulin (50 kDa). G, Mean intensity of PEPCK and P-CREB normalized to tubulin as quantified from Western blot analysis.
Figure 5
Figure 5
Liver histology from 1-yr-old control and Arx-deficient mice. A, H&E and Oil red O staining of 1-yr-old control and Arx-deficient mice. B, Plasma lipid profile of 4-month-old control and Arx-deficient animals after a 16-h fast. C, Plasma epinephrine and norepinephrine levels of 3- to 6-month-old mice after a 16-h fast. D, Blood glucose levels measured during and after STZ treatment. Day 1–5 was measured after a 4-h fast, d 6 onwards was measured after a 1-h fast. Values are mean ± sem from at least three mice per group. *, P < 0.05 between genotypes.

References

    1. Unger RH 1971 Glucagon and the insulin: glucagon ratio in diabetes and other catabolic illnesses. Diabetes 20:834–838 - PubMed
    1. Burcelin R, Katz EB, Charron MJ 1996 Molecular and cellular aspects of the glucagon receptor: role in diabetes and metabolism. Diabetes Metab 22:373–396 - PubMed
    1. Toft I, Gerich JE, Jenssen T 2002 Autoregulation of endogenous glucose production during hyperglucagonemia. Metabolism 51:1128–1134 - PubMed
    1. Jiang G, Zhang B 2003 Glucagon and regulation of glucose metabolism. Am J Physiol Endocrinol Metab 284:671–678 - PubMed
    1. Consoli A 1992 Role of liver in pathophysiology of NIDDM. Diabetes Care 15:430–441 - PubMed

Publication types