. 2010 Sep;299(3):R751-61.
doi: 10.1152/ajpregu.00746.2009. Epub 2010 Jun 30.

Lateralization of the central circadian pacemaker output: a test of neural control of peripheral oscillator phase

Affiliations

Lateralization of the central circadian pacemaker output: a test of neural control of peripheral oscillator phase

Carrie E Mahoney et al. Am J Physiol Regul Integr Comp Physiol. 2010 Sep.

Abstract

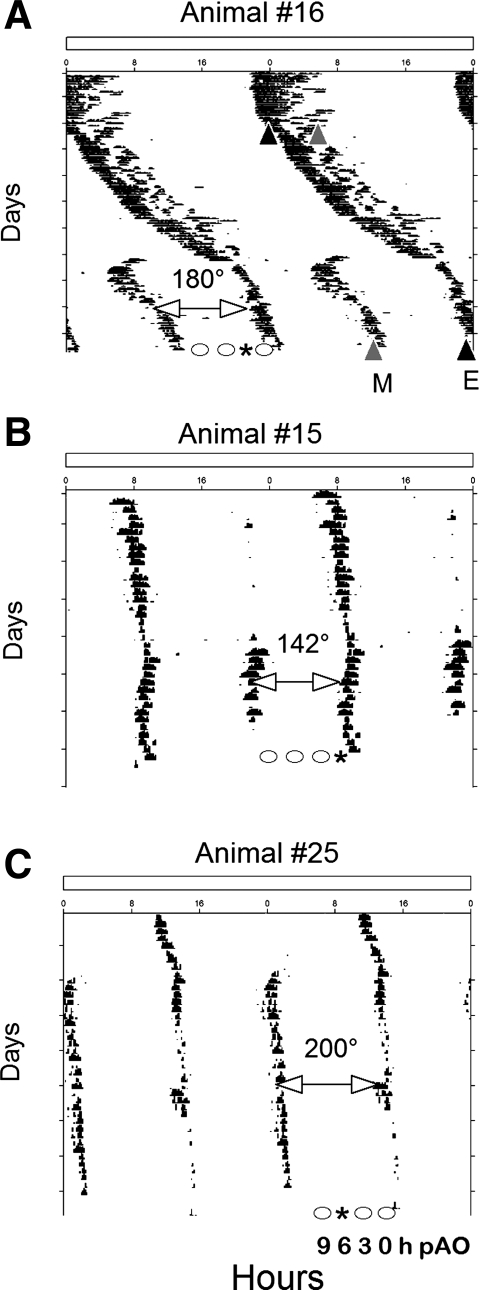
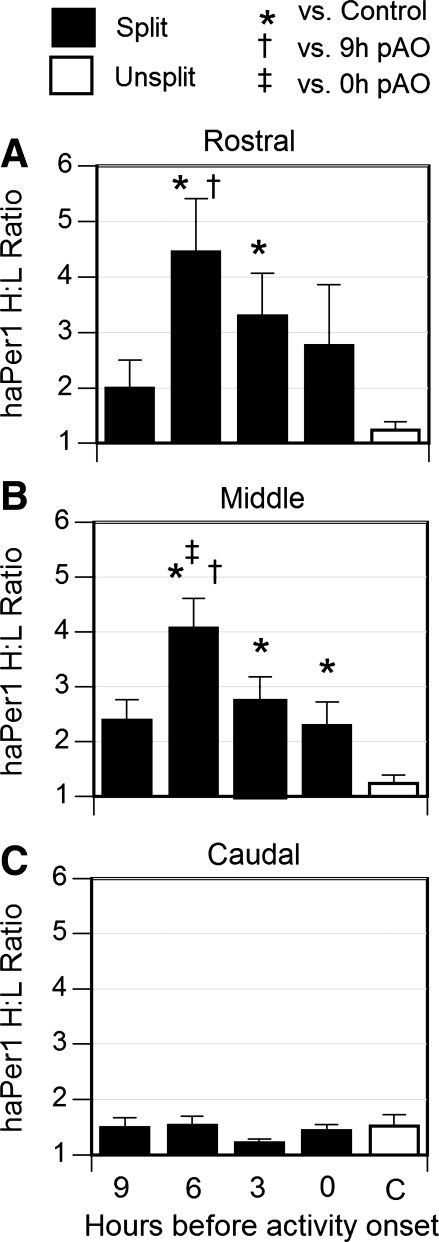
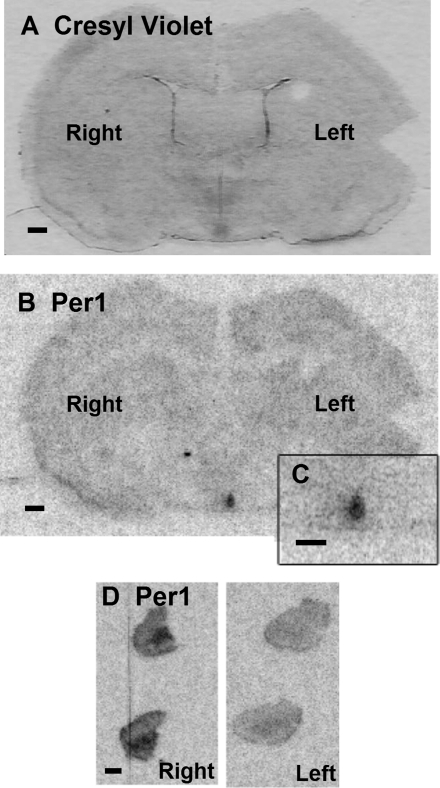
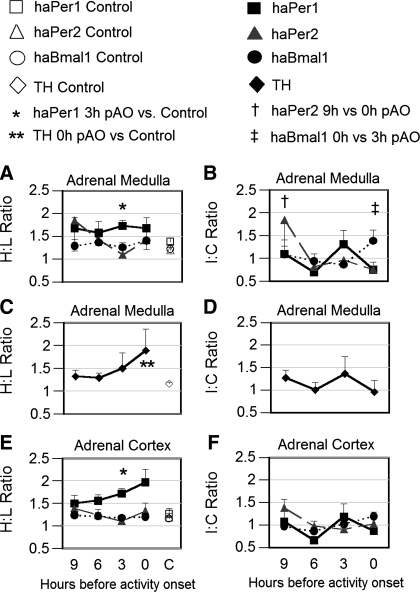
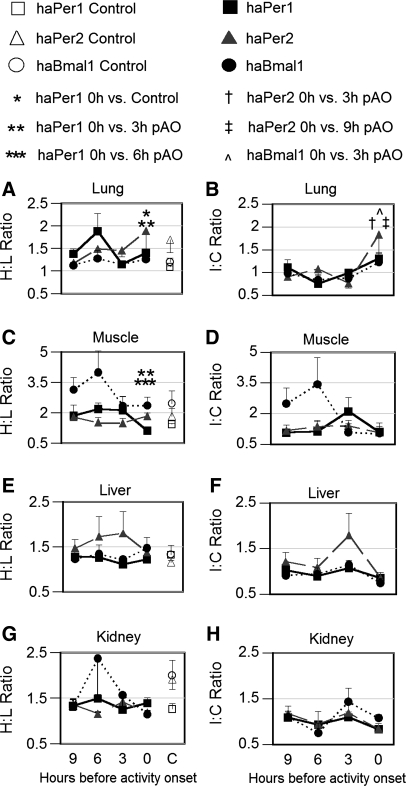
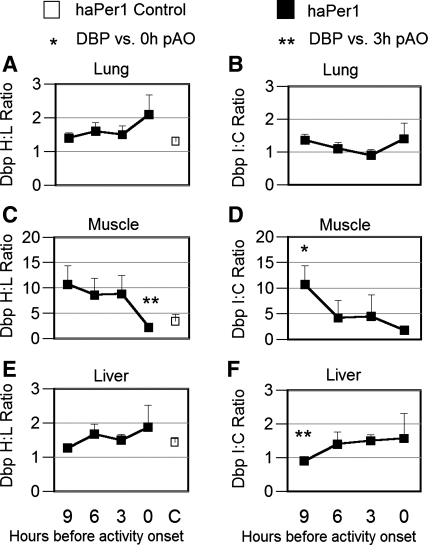
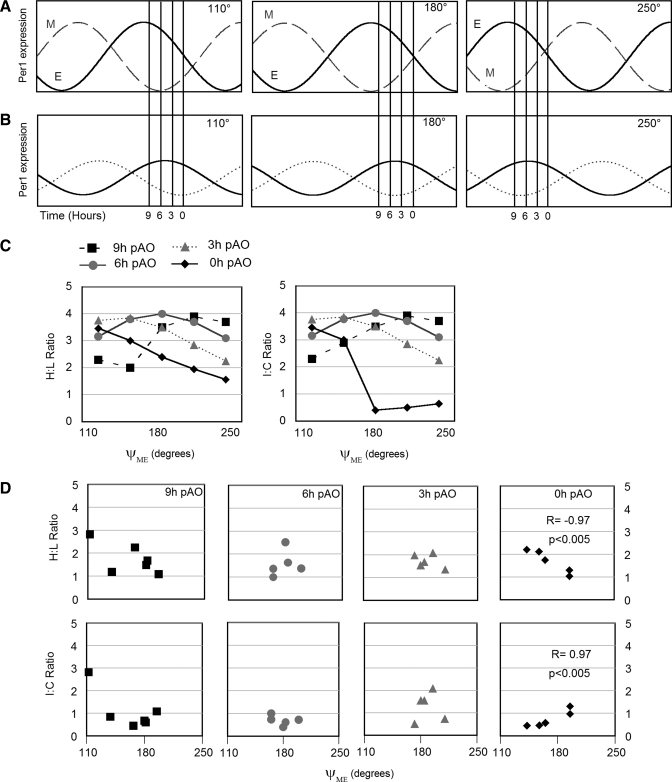
To evaluate the contribution of neural pathways to the determination of the circadian oscillator phase in peripheral organs, we assessed lateralization of clock gene expression in Syrian hamsters induced to split rhythms of locomotor activity by exposure to constant light. We measured the ratio of haPer1, haPer2, and haBmal1 mRNA on the high vs. low (H/L) side at 3-h intervals prior to the predicted activity onset (pAO). We also calculated expression on the sides ipsilateral vs. contralateral (I/C) to the side of the suprachiasmatic nucleus (SCN) expressing higher haPer1. The extent of asymmetry in split hamsters varied between specific genes, phases, and organs. Although the magnitude of asymmetry in peripheral organs was never as great as that in the SCN, we observed significantly greater lateralization of clock gene expression in the adrenal medulla and cortex, lung, and skeletal muscle, but not in liver or kidney, of split hamsters than of unsplit controls. We observed fivefold lateralization of expression of the clock-controlled gene, albumin site D-element binding protein (Dbp), in skeletal muscle (H/L: 10.7 +/- 3.7 at 3 h vs. 2.2 +/- 0.3 at 0 h pAO; P = 0.03). Furthermore, tyrosine hydroxylase expression was asymmetrical in the adrenal medulla of split (H/L: 1.9 +/- 0.5 at 0 h) vs. unsplit hamsters (1.2 +/- 0.04; P < 0.05). Consistent with a model of neurally controlled gene expression, we found significant correlations between the phase angle between morning and evening components (psi(me)) and the level of asymmetry (H/L or I/C). Our results indicate that neural pathways contribute to, but cannot completely account for, SCN regulation of the phase of peripheral oscillators.


Figures

Fig. 1.
Fig. 1.
A–C: representative double-plotted running records of hamsters whose locomotor activity split in exposure to constant light (LL). E (black triangle in A) and M (gray triangle in A) are evening and morning components, respectively. The phase angle between morning and evening components (ψme) of 180 degrees (A), 142 degrees (B), and 200 degrees (C) are illustrated. Animals were killed at 9, 6, 3, or 0 h before the predicted activity onset (pAO; phases indicated as circles in each actogram). *Time of sampling of these individuals at 3-h (A), 0-h (B) and 6-h (C) pAO.
Fig. 2.
Fig. 2.
High-to-low (H/L) ratio (mean ± SE) of haPer1 expression in rostral (A), middle (B), and caudal (C) coronal planes of the suprachiasmatic nucleus (SCN) was determined by measurement of optical density of autoradiograms generated by in situ hybridization. Filled bars, ratios calculated in hamsters that split in LL killed at the indicated times before pAO. Open bar, unsplit controls killed 3-h pAO. *P < 0.05 vs. unsplit control, †P < 0.05 vs. 9-h pAO, ‡P < 0.05 vs. 0-h pAO.
Fig. 3.
Fig. 3.
haPer1 expression in brain and adrenal gland of split hamsters. A: coronal brain section stained with cresyl violet demonstrating the left and right nuclei of the SCN of an animal killed 3-h pAO in experiment 1. B: corresponding autoradiogram of the brain section in A showing haPer1 expression assessed by in situ hybridization (scale bar = 0.05 cm). Inset, C: haPer1 mRNA in SCN at higher magnification (scale bar = 0.05 cm). Striking lateralization of haPer1 expression was evident in both SCN (B and C) and adrenal gland (D). Two serial sections of whole adrenal from each side are shown (scale bar = 0.05 cm).
Fig. 4.
Fig. 4.
Levels of gene expression in adrenal medulla (A–D) and adrenal cortex (E and F) of hamsters exposed to LL in experiment 3. Filled symbols represent data from split hamsters killed at 9-h (n = 6), 6-h (n = 5), 3-h (n = 5), and 0-h (n = 5) pAO. Open symbols represent data of unsplit controls (n = 5) killed at 3-h pAO. Left: asymmetry assessed as H/L ratio (A, C, and E); Right: asymmetry expressed as ratio of mRNA on sides ipsilateral vs. contralateral to the side of the SCN showing higher haPer1 expression in the same hamster (I/C; B, D, and F). Serial sections of the adrenals from each animal were processed by in situ hybridization for haPer1 (squares), haPer2 (triangles), haBmal1 (circles; A, B, E, and F), and for tyrosine hydroxylase (diamonds; C and D). Statistical significance: *P < 0.05 vs. unsplit control for haPer1 in adrenal medulla and cortex; tyrosine hydroxylase expression **P < 0.05 vs. unsplit control, †P < 0.05 vs. 0-h pAO for haPer2 only, and ‡P < 0.05 vs. 3-h pAO for haBmal1 only in adrenal medulla.
Fig. 5.
Fig. 5.
Left: H/L ratio (mean ± SE) of haPer1 (squares), haPer2 (triangles) and haBmal1 (circles) expression in lung (A), skeletal muscle (C), liver (E), and kidney (G) of split animals (filled symbols) killed at 9-h (n = 6), 6-h (n = 5), 3-h (n = 5), and 0-h (n = 5) pAO and in unsplit controls (n = 5; open symbols) in experiment 3. Gene expression was assessed by quantitative real-time PCR (qrtPCR) and normalized to GAPDH (see methods). Statistical significance: *P < 0.05 vs. unsplit control and **P < 0.05 vs. 3-h pAO for haPer1 only in lung; ***P < 0.05 vs. 6-h pAO and **P < 0.05 vs. 3-h pAO for haPer1 only in muscle. Right: ratio of clock gene expression (I/C; mean ± SE) between sides of lung (B), skeletal muscle (D), liver (F), and kidney (H) ipsilateral vs. contralateral to side of SCN in which haPer1 expression was higher. Statistical significance: †P < 0.05 haPer2 vs. 3-h pAO and ‡P < 0.05 haPer2 vs. 9-h pAO; P < 0.05 haBma1 vs. 3-h pAO.
Fig. 6.
Fig. 6.
Left: H/L ratio (mean ± SE) of D-element binding protein (Dbp) expression in lung (A), skeletal muscle (C), and liver (E) of split animals (filled symbols) killed at 9-h (n = 6), 6-h (n = 5), 3-h (n = 5), and 0-h (n = 5) pAO and in unsplit controls (n = 5; open symbols) in experiment 3. Right: I/C ratio of the clock-controlled gene, Dbp, between sides of lung (B), skeletal muscle (D), and liver (F) ipsilateral vs. contralateral to the side of the SCN in which haPer1 expression was higher. Gene expression was assessed by qrtPCR and normalized to GAPDH (see methods). Statistical significance: *P < 0.05 vs. 0-h pAO and **P < 0.05 vs. 3-h pAO.
Fig. 7.
Fig. 7.
Model of the dependence of neurally driven rhythms of clock gene expression on the phase relationship between evening (E) and morning (M) oscillators. Hypothetical model of asymmetrical CG expression in SCN (A) and peripheral organs (B). A: Per1 mRNA abundance in the SCN of split animals is represented as a sinusoid, with the nuclei driving the E and M activity bouts shown separately (solid and dashed lines, respectively). B: Per1 oscillations in peripheral organs ipsilateral (solid line) and contralateral (dotted) to the E nucleus of the SCN. A lag of 6 h between pacemaker and slave is depicted. For both A and B, phase relationships are illustrated for ψme of 110° (left), 180° (middle), and 250° (right; see Fig. 1 for actual data). Vertical lines at 9-h, 6-h, 3-h, and 0-h pAO before the half-maximum of Per1 within the E nucleus of the SCN represent phases of organ collection. Amplitude of oscillation in peripheral organs is depicted as half that of SCN due to nonneural contribution and/or partial crossing of pathways descending from SCN. C: relationship between the H/L ratio (left) and I/C ratio (right) as a function of ψme at 9-h (squares), 6-h (circles), 3-h (triangles), and 0-h (diamonds) pAO predicted from the model. Note that the effect of ψme on H/L or I/C ratio can be diametrically opposite when sampling is done at different phases. D: empirically measured asymmetry of Per1 expression in adrenal medulla of split hamsters is plotted as a function of phase relationship between the E and M components. The dependence of H/L and I/C ratios on ψme at 0-h pAO was statistically significant in the adrenal medulla (see Supplemental Fig. 3). In groups showing a full range of ψme at particular pAO, the empirical data correspond to the model.

References

    1. Abrahamson EE, Moore RY. Suprachiasmatic nucleus in the mouse: retinal innervation, intrinsic organization and efferent projections. Brain Res 916: 172–191, 2001 - PubMed
    1. Akhtar RA, Reddy AB, Maywood ES, Clayton JD, King VM, Smith AG, Gant TW, Hastings MH, Kyriacou CP. Circadian cycling of the mouse liver transcriptome, as revealed by cDNA microarray, is driven by the suprachiasmatic nucleus. Curr Biol 12: 540–550, 2002 - PubMed
    1. Balsalobre A, Brown SA, Marcacci L, Tronche F, Kellendonk C, Reichardt HM, Schütz G, Schibler U. Resetting of circadian time in peripheral tissues by glucocorticoid signaling. Science 289: 2344–2347, 2000 - PubMed
    1. Bando H, Nishio T, van der Horst GT, Masubuchi S, Hisa Y, Okamura H. Vagal regulation of respiratory clocks in mice. J Neurosci 27: 4359–4365, 2007 - PMC - PubMed
    1. Bartness TJ, Song CJ, Demas GE. SCN efferents to peripheral tissues: implications for biological rhythms. J Biol Rhythms 16: 196–204, 2001 - PubMed

Publication types

Substances

LinkOut - more resources