

Acute daily psychological stress causes increased atrophic gene expression and myostatin-dependent muscle atrophy
- PMID: 20592178
- PMCID: PMC2944429
- DOI: 10.1152/ajpregu.00296.2010
Acute daily psychological stress causes increased atrophic gene expression and myostatin-dependent muscle atrophy
Abstract
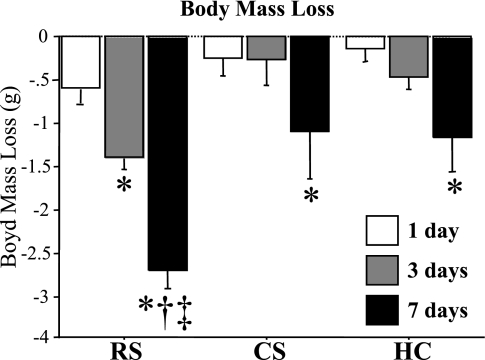
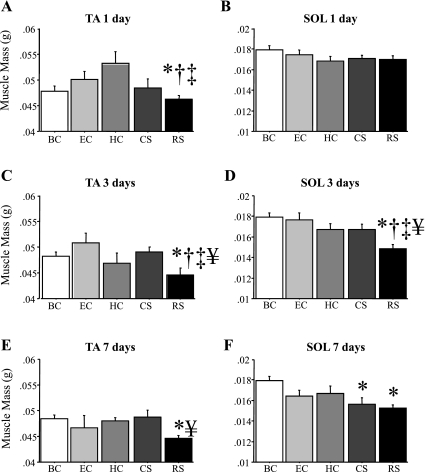
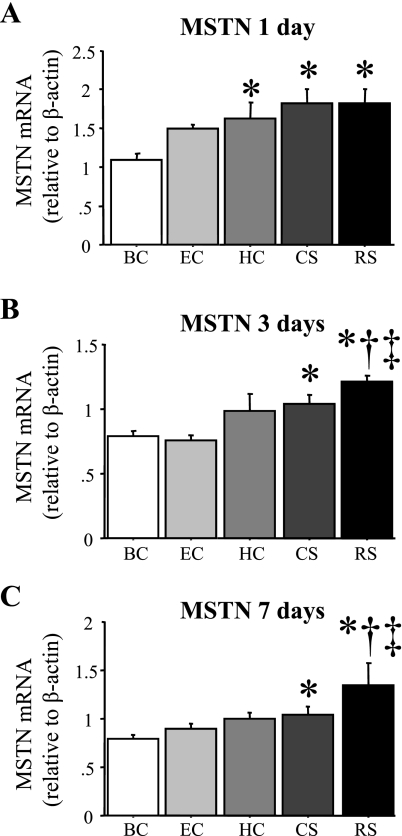
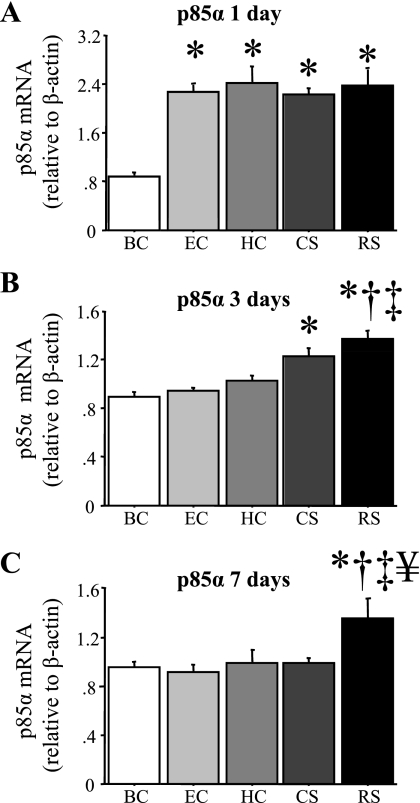
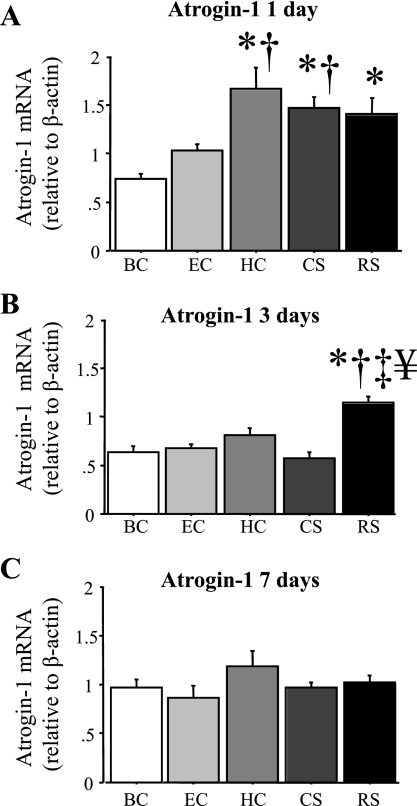
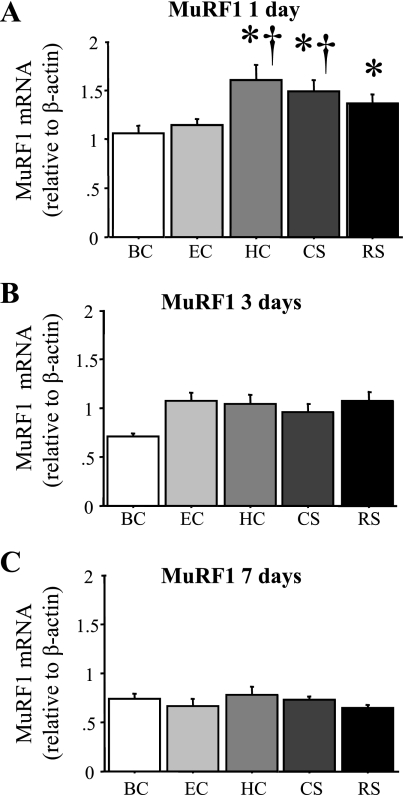
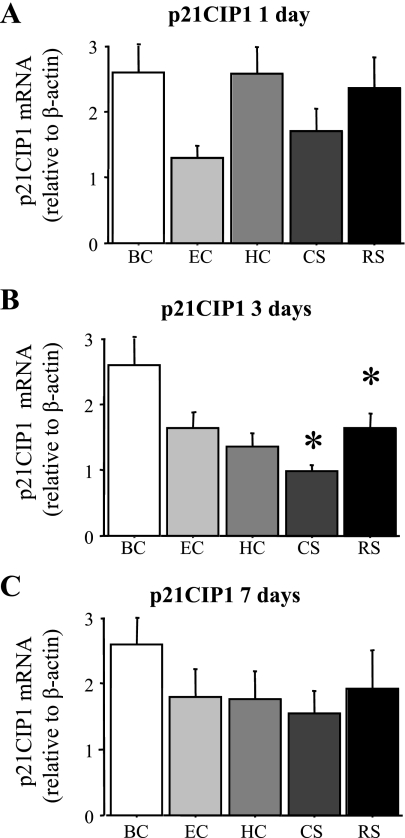
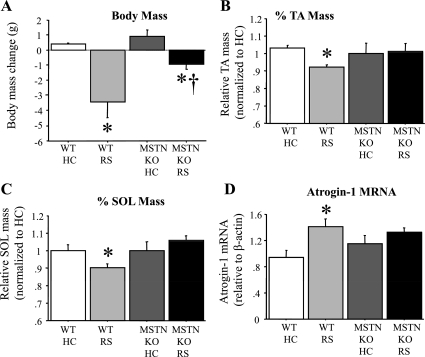
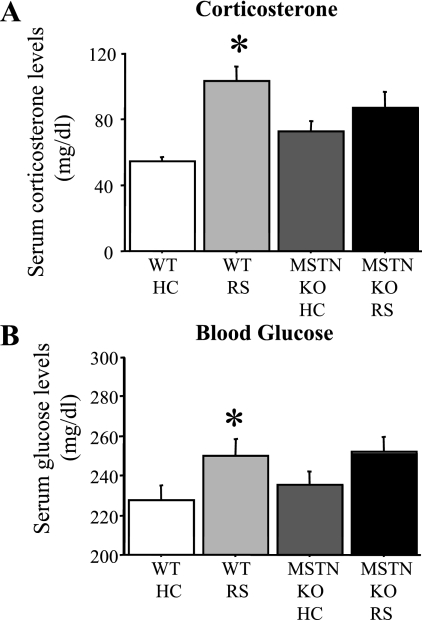
Psychological stress is known to attenuate body size and lean body mass. We tested the effects of 1, 3, or 7 days of two different models of psychological stress, 1 h of daily restraint stress (RS) or daily cage-switching stress (CS), on skeletal muscle size and atrophy-associated gene expression in mice. Thymus weights decreased in both RS and CS mice compared with unstressed controls, suggesting that both models activated the hypothalamic-pituitary-adrenal axis. Body mass was significantly decreased at all time points for both models of stress but was greater for RS than CS. Mass of the tibialis anterior (TA) and soleus (SOL) muscles was significantly decreased after 3 and 7 days of RS, but CS only significantly decreased SOL mass after 7 days. TA mRNA levels of the atrophy-associated genes myostatin (MSTN), atrogin-1, and the phosphatidylinositol 3-kinase inhibitory subunit p85alpha were all significantly increased relative to unstressed mice after 1 and 3 days of RS, and expression of MSTN and p85alpha mRNA remained elevated after 7 days of RS. Expression of muscle ring finger 1 was increased after 1 day of RS but returned to baseline at 3 and 7 days of RS. MSTN, atrogin-1, and p85alpha mRNA levels also significantly increased after 1 and 3 days of CS but atrogen-1 mRNA levels had resolved back to normal levels by 3 days and p85alpha with 7 days of CS. p21CIP mRNA levels were significantly decreased by 3 days of CS or RS. Finally, body mass was minimally affected, and muscle mass was completely unaffected by 3 days of RS in mice null for the MSTN gene, and MSTN inactivation attenuated the increase in atrogin-1 mRNA levels with 4 days of RS compared with wild-type mice. Together these data suggest that acute daily psychological stress induces atrophic gene expression and loss of muscle mass that appears to be MSTN dependent.
Figures
Similar articles
-
Myostatin expression is increased by food deprivation in a muscle-specific manner and contributes to muscle atrophy during prolonged food deprivation in mice.J Appl Physiol (1985). 2010 Sep;109(3):692-701. doi: 10.1152/japplphysiol.00504.2010. Epub 2010 Jul 1. J Appl Physiol (1985). 2010. PMID: 20595541
-
Translational signalling, atrogenic and myogenic gene expression during unloading and reloading of skeletal muscle in myostatin-deficient mice.PLoS One. 2014 Apr 9;9(4):e94356. doi: 10.1371/journal.pone.0094356. eCollection 2014. PLoS One. 2014. PMID: 24718581 Free PMC article.
-
Quadriceps muscle atrophy after anterior cruciate ligament transection involves increased mRNA levels of atrogin-1, muscle ring finger 1, and myostatin.Am J Phys Med Rehabil. 2013 May;92(5):411-9. doi: 10.1097/PHM.0b013e3182643f82. Am J Phys Med Rehabil. 2013. PMID: 22854904
-
Targeting the myostatin signaling pathway to treat muscle loss and metabolic dysfunction.J Clin Invest. 2021 May 3;131(9):e148372. doi: 10.1172/JCI148372. J Clin Invest. 2021. PMID: 33938454 Free PMC article. Review.
-
Myostatin and muscle atrophy during chronic kidney disease.Nephrol Dial Transplant. 2021 Nov 9;36(11):1986-1993. doi: 10.1093/ndt/gfaa129. Nephrol Dial Transplant. 2021. PMID: 32974666 Review.
Cited by
-
Chronic intrinsic transient tracheal occlusion elicits diaphragmatic muscle fiber remodeling in conscious rodents.PLoS One. 2012;7(11):e49264. doi: 10.1371/journal.pone.0049264. Epub 2012 Nov 1. PLoS One. 2012. PMID: 23133678 Free PMC article.
-
The Electrical Stimulation of the Bed Nucleus of the Stria Terminalis Causes Oxidative Stress in Skeletal Muscle of Rats.Oxid Med Cell Longev. 2018 May 31;2018:4671213. doi: 10.1155/2018/4671213. eCollection 2018. Oxid Med Cell Longev. 2018. PMID: 29955246 Free PMC article.
-
Corticotropin releasing factor-overexpressing mouse is a model of chronic stress-induced muscle atrophy.PLoS One. 2020 Feb 12;15(2):e0229048. doi: 10.1371/journal.pone.0229048. eCollection 2020. PLoS One. 2020. PMID: 32049987 Free PMC article.
-
Double Muscling in Cattle: Genes, Husbandry, Carcasses and Meat.Animals (Basel). 2012 Sep 20;2(3):472-506. doi: 10.3390/ani2030472. Animals (Basel). 2012. PMID: 26487034 Free PMC article. Review.
-
BST Stimulation Induces Atrophy and Changes in Aerobic Energy Metabolism in Rat Skeletal Muscles-The Biphasic Action of Endogenous Glucocorticoids.Int J Mol Sci. 2020 Apr 17;21(8):2787. doi: 10.3390/ijms21082787. Int J Mol Sci. 2020. PMID: 32316389 Free PMC article.
References
-
- Allen DL, Unterman TG. Regulation of myostatin expression and myoblast differentiation by FoxO and SMAD transcription factors. Am J Physiol Cell Physiol 292: C188–C199, 2007 - PubMed
-
- Allen DL, Cleary AS, Speaker KJ, Lindsay SF, Uyenishi J, Reed JM, Madden MC, Mehan RS. Myostatin, activin receptor IIb, and follistatin-like-3 gene expression are altered in adipose tissue and skeletal muscle of obese mice. Am J Physiol Endocrinol Metab 294: E918–E927, 2008 - PubMed
-
- Björntorp P. Visceral fat accumulation: the missing link between psychosocial factors and cardiovascular disease? J Intern Med 230: 195–201, 1991 - PubMed
Publication types
MeSH terms
Substances
Grants and funding
LinkOut - more resources
Full Text Sources
Other Literature Sources
Medical
Miscellaneous