. 2010 Jul 15;123(Pt 14):2453-63.
doi: 10.1242/jcs.066910.

Temporal regulation of the muscle gene cascade by Macho1 and Tbx6 transcription factors in Ciona intestinalis

Affiliations

Temporal regulation of the muscle gene cascade by Macho1 and Tbx6 transcription factors in Ciona intestinalis

Jamie E Kugler et al. J Cell Sci. .

Abstract

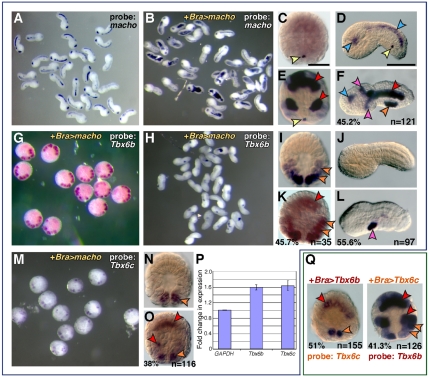
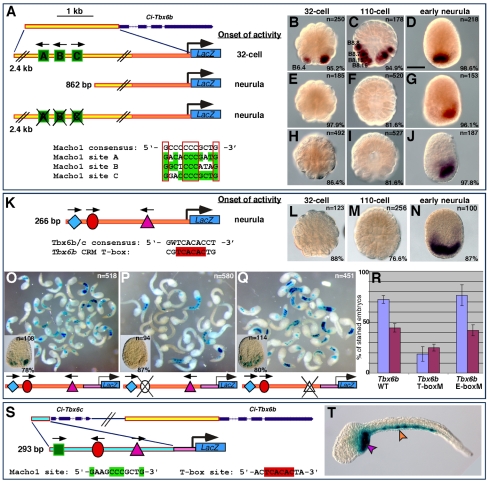
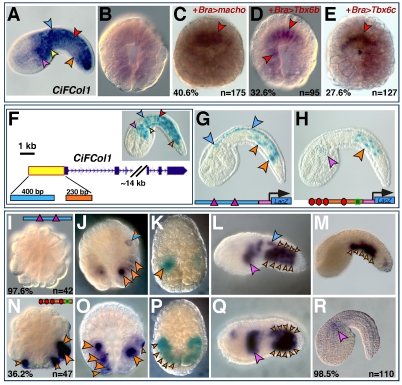
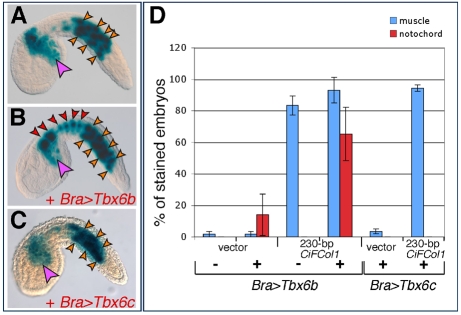
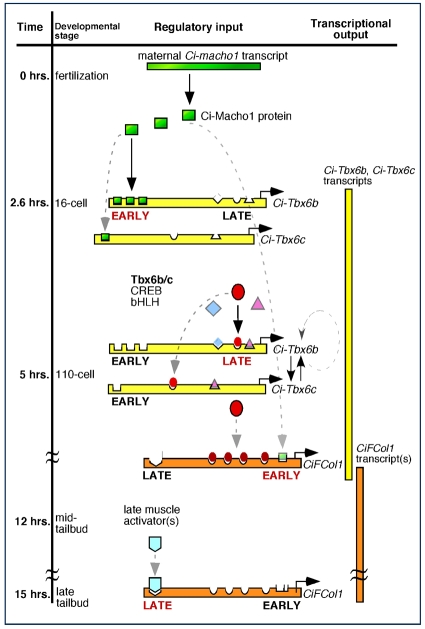
For over a century, muscle formation in the ascidian embryo has been representative of 'mosaic' development. The molecular basis of muscle-fate predetermination has been partly elucidated with the discovery of Macho1, a maternal zinc-finger transcription factor necessary and sufficient for primary muscle development, and of its transcriptional intermediaries Tbx6b and Tbx6c. However, the molecular mechanisms by which the maternal information is decoded by cis-regulatory modules (CRMs) associated with muscle transcription factor and structural genes, and the ways by which a seamless transition from maternal to zygotic transcription is ensured, are still mostly unclear. By combining misexpression assays with CRM analyses, we have identified the mechanisms through which Ciona Macho1 (Ci-Macho1) initiates expression of Ci-Tbx6b and Ci-Tbx6c, and we have unveiled the cross-regulatory interactions between the latter transcription factors. Knowledge acquired from the analysis of the Ci-Tbx6b CRM facilitated both the identification of a related CRM in the Ci-Tbx6c locus and the characterization of two CRMs associated with the structural muscle gene fibrillar collagen 1 (CiFCol1). We use these representative examples to reconstruct how compact CRMs orchestrate the muscle developmental program from pre-localized ooplasmic determinants to differentiated larval muscle in ascidian embryos.


Figures

Fig. 1.
Fig. 1.
Transcriptional changes in response to ectopically expressed Ci-Macho1, Ci-Tbx6b and Ci-Tbx6c. (A-O,Q) Microphotographs of control and transgenic Ciona intestinalis embryos hybridized in situ with digoxigenin-labeled antisense RNA probes. Note that in some cases, because of mosaic incorporation of the transgene(s), not all the cells of the same lineage show staining. The percentages of transgenic embryos displaying the patterns shown, and the total number of embryos scored, are indicated at the bottom of each panel. (A,B,D,F,H,J,L) Mid-tailbud embryos; individual embryos are oriented with anterior to the left, dorsal up. (A,B,G,H,M) Low-magnification microphotographs of embryos from representative experiments. (C,E,G,I,K,M-O,Q) 110-cell-stage embryos, vegetal views. (A-P) Effects of the misexpression of Ci-macho1 on Ci-Tbx6b and Ci-Tbx6c expression. (A,C,D) Control embryos expressing zygotic Ci-macho1 in germ-line precursors (yellow arrowhead), sensory vesicle and nerve cord (blue arrowheads). (B,E,F) Bra>macho transgenics efficiently misexpress Ci-macho1 in notochord (red arrowheads) and mesenchyme cells (pink arrowheads) at early (E) and late stages (F). (G,H) Bra>macho transgenics hybridized with the Ci-Tbx6b probe. (I,J) Ci-Tbx6b is expressed at the 110-cell stage in muscle precursors (I; orange arrowheads) but is no longer expressed by the early tailbud stage (J; see also supplementary material Fig. S1A-C). (K) Ectopic expression of Ci-Tbx6b is detected in the notochord of 110-cell-stage Bra>macho transgenics (red arrowhead). (L) Mid-tailbud Bra>macho embryos show ectopic expression of Ci-Tbx6b only in mesenchyme (pink arrowhead). (M) Bra>macho transgenics hybridized with the Ci-Tbx6c probe. (N) Expression of Ci-Tbx6c in control embryos is detected in a subset of muscle precursors (orange arrowheads). (O) In 110-cell Bra>macho embryos, ectopic expression of Ci-Tbx6c is detected in notochord precursors (red arrowheads). (P) Changes in gene expression in 110-cell stage Bra>macho embryos versus control embryos, as monitored by qRT-PCR. (Q) Left panel shows a 110-cell-stage Bra>Tbx6b embryo hybridized with the Ci-Tbx6c probe. Right panel shows a 110-cell-stage Bra>Tbx6c embryo hybridized with the Ci-Tbx6b probe. Ectopic notochord staining is indicated by red arrowheads. Scale bars: 50 μm.
Fig. 2.
Fig. 2.
Identification of the early and late Ci-Tbx6b CRMs and prediction of a related muscle CRM in the Ci-Tbx6c locus. (A) Schematic representation of the Ci-Tbx6b locus as shown in the JGI Ciona intestinalis genome browser (Dehal et al., 2002) (http://genome.jgi-psf.org/Cioin2/Cioin2.home.html). Dark blue boxes and dashed lines indicate exons and introns, respectively. A yellow rectangle represents the 2.4 kb fragment that was analyzed. Green boxes represent putative Ci-Macho1-binding sites; black arrows indicate their orientations. The orange rectangle depicts the proximal region of the 2.4 kb fragment. Bottom panel shows alignment of the Ci-Macho1 sites with the consensus sequence identified by Yagi and colleagues (Yagi et al., 2004a). Highly conserved nucleotides are boxed in red. (B-J) Embryos electroporated with either the 2.4 kb Ci-Tbx6b CRM (B-D), the 862 bp fragment (E-G) or the 2.4 kb CRM carrying mutations in all Ci-Macho1-binding sites (H-J) were fixed at the 32-cell (B,E,H), 110-cell (C,F,I), or early neurula (D,G,J) stage and hybridized in situ with a lacZ probe. Stained blastomeres are labeled only on one side of the embryos (Conklin, 1905; Meinertzhagen and Okamura, 2001). (K) The 266 bp proximal region of the Ci-Tbx6b CRM (orange in A) contains putative binding sites for CREB (blue diamond), T-box (red oval) and bHLH (‘AC’-core E-box; pink triangle) transcription factors. (L-N) Embryos carrying the 266 bp Ci-Tbx6b transgene in K, hybridized in situ with a lacZ probe. (O-Q) Mutation analysis of the Ci-Tbx6b proximal CRM. A 112 bp subfragment of the 266 bp CRM, containing the three putative binding sites shown in K, was cloned upstream of the Ci-FoxA-a basal promoter (pink box) and subjected to truncation (data not shown) and mutation analysis. (O) Low-magnification image of mid-tailbud embryos electroporated with the wild-type 112 bp Ci-Tbx6b CRM. (P) Mid-tailbud embryos electroporated with the 112 bp Ci-Tbx6b CRM carrying a mutation in the Ci-Tbx6b/c core binding site (TCACAC>TCAaca). (Q) Mid-tailbud embryos electroporated with the 112 bp Ci-Tbx6b CRM carrying a mutation in the E-box sequence (CAGTTG>actggt). Insets in (O-Q) show transgenic embryos fixed at the neurula stage. (R) Graph showing the percentage (mean ± s.d.) of stained mid-tailbud embryos in O-Q; blue columns, muscle staining; purple, mesenchyme. The number of embryos scored for each construct is shown in white in O-Q. (S) Organization of the Ci-Tbx6c and Ci-Tbx6b genomic locus. The predicted Ci-Tbx6c CRM (blue rectangle) contains one Ci-Macho1-binding site, one T-box site and an AC-core E-box. (T) Late-tailbud embryo electroporated with the Ci-Tbx6c CRM, showing activity in muscle (orange arrowhead) and mesenchyme (pink arrowhead). B,E,H,L, vegetal views; C,F,I,M, dorsal-vegetal views; D,G,J,N, dorsal views, with anterior to the top. Scale bar: 50 μm.
Fig. 3.
Fig. 3.
The Ciona CiFCol1 gene and its CRMs. (A) Mid-tailbud Ciona embryo hybridized in situ with the CiFCol1 probe. Arrowhead color code: blue, CNS; pink, mesenchyme; red, notochord; orange, muscle; yellow: endoderm. Expression at other stages is available online at http://ghost.zool.kyoto-u.ac.jp/cgi-bin3/photoget2.cgi?CLSTR00093 (Satou et al., 2001). (B-E) 110-cell-stage embryos hybridized with the CiFCol1 probe. (B) Control embryo. (C-E) Embryos carrying the transgenes indicated on the top right. Ectopic notochord staining is highlighted by red arrowheads. (F) Partial representation of the CiFCol1 gene locus. The yellow box depicts the 2.2 kb cis-regulatory region that fully recapitulates the CiFCol1 expression pattern; a blue and an orange box indicate the distal and proximal muscle CRMs, respectively. Inset shows a mid-tailbud embryo electroporated with the 2.2 kb region. (G,H) Microphotographs of X-Gal-stained Ciona embryos electroporated with the 400 bp and 230 bp regions shown in F, cloned upstream of the FoxA-a basal promoter (pink box in the schematics). The distal region (G) contains two E-boxes (pink triangles); the proximal region (H) contains four putative Ci-Tbx6b/c-binding sites (red ovals) and one putative Ci-Macho1 site (green square). (I-R) Embryos electroporated with either the distal (I-M), or the proximal muscle CRM (N-R), fixed at the 32-cell (I,N) 110-cell (J,O), early tailbud (L,Q) and mid-tailbud (M,R) stage and hybridized with a lacZ probe. (K,P) Early neurula embryos electroporated with either the distal (K) or the proximal CRM (P), stained with X-Gal.
Fig. 4.
Fig. 4.
Effects of the ectopic expression of Ci-Tbx6b and Ci-Tbx6c on CiFCol1 muscle CRMs. (A-C) Ciona embryos electroporated with the CiFCol1 proximal CRM, alone (A) or in combination with either Bra>Tbx6b (B) or Bra>Tbx6c (C). Arrowhead color code: red, notochord; orange, muscle; pink, mesenchyme. (D) Graph showing the percentages (mean ± s.d.) of embryos displaying staining in muscle (blue columns) and in notochord (red columns) in the experiments shown in (A-C), as well as the baseline staining attributable to the vector. ‘+’ and ‘−’ signs indicate the presence or absence, respectively, of either misexpression construct. Note that the height of the error bars on the red columns reflects the sporadic occurrence of the activation of the empty vector in notochord cells, which is observed only in some batches of embryos.
Fig. 5.
Fig. 5.
A working model for the muscle cis-regulatory hierarchy in Ciona. The regulatory interactions identified by this study are summarized and plotted against the developmental time-course of Ciona embryogenesis at 18°C (black vertical bar on left). Horizontal green bar represents the maternally-deposited Ci-macho1 transcripts, green squares depict the Ci-Macho1 protein. Horizontal bars symbolize the cis-regulatory regions of Ci-Tbx6b and Ci-Tbx6c (yellow) and CiFCol1 (orange); transcription start sites are indicated by horizontal arrows. Transcripts are shown in scheme as vertical bars on the right. Transcription factors are depicted as described in Fig. 2.

Similar articles

Cited by

References

    1. Aruga J., Kamiya A., Takahashi H., Fujimi T. J., Shimizu Y., Ohkawa K., Yazawa S., Umesono Y., Noguchi H., Shimizu T., et al. (2006). A wide-range phylogenetic analysis of Zic proteins: implications for correlations between protein structure conservation and body plan complexity. Genomics 87, 783-792 - PubMed
    1. Bertrand V., Hudson C., Caillol D., Popovici C., Lemaire P. (2004). Neural tissue in ascidian embryos is induced by FGF9/16/20, acting via a combination of maternal GATA and Ets transcription factors. Cell 115, 615-627 - PubMed
    1. Brown C. D., Johnson D. S., Sidow A. (2007). Functional architecture and evolution of transcriptional elements that drive gene coexpression. Science 317, 1557-1560 - PubMed
    1. Chapman D. L., Papaioannou V. E. (1998). Three neural tubes in mouse embryos with mutations in the T-box gene Tbx6. Nature 391, 695-697 - PubMed
    1. Christiaen L., Stolfi A., Davidson B., Levine M. (2009). Spatio-temporal intersection of Lhx3 and Tbx6 defines the cardiac field through synergistic activation of Mesp. Dev. Biol. 328, 552-560 - PubMed

Publication types

MeSH terms