. 2010 Jun 30;30(26):8745-58.
doi: 10.1523/JNEUROSCI.4417-09.2010.

Visual function in mice with photoreceptor degeneration and transgenic expression of channelrhodopsin 2 in ganglion cells

Affiliations

Visual function in mice with photoreceptor degeneration and transgenic expression of channelrhodopsin 2 in ganglion cells

Senthil Thyagarajan et al. J Neurosci. .

Abstract

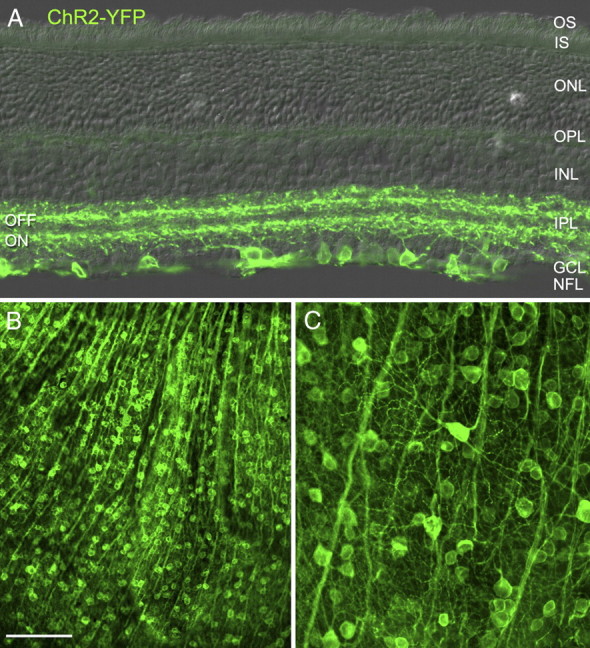
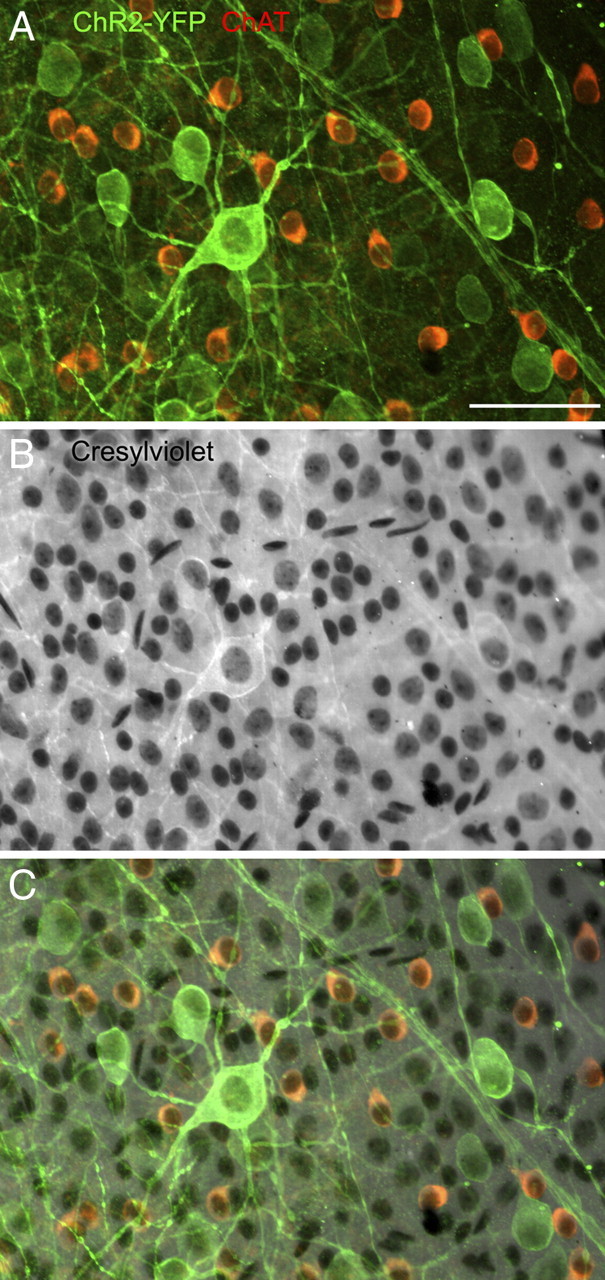
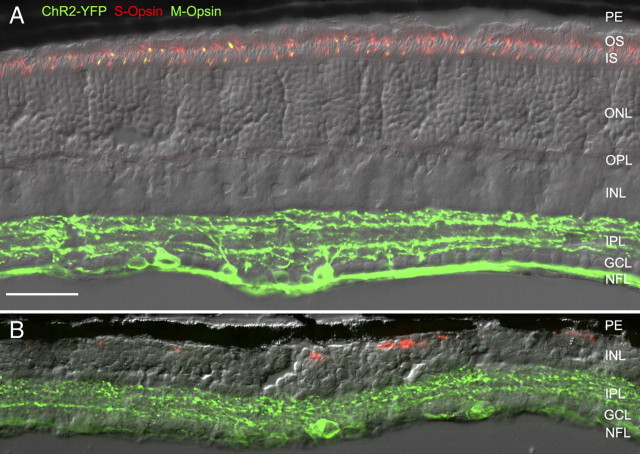
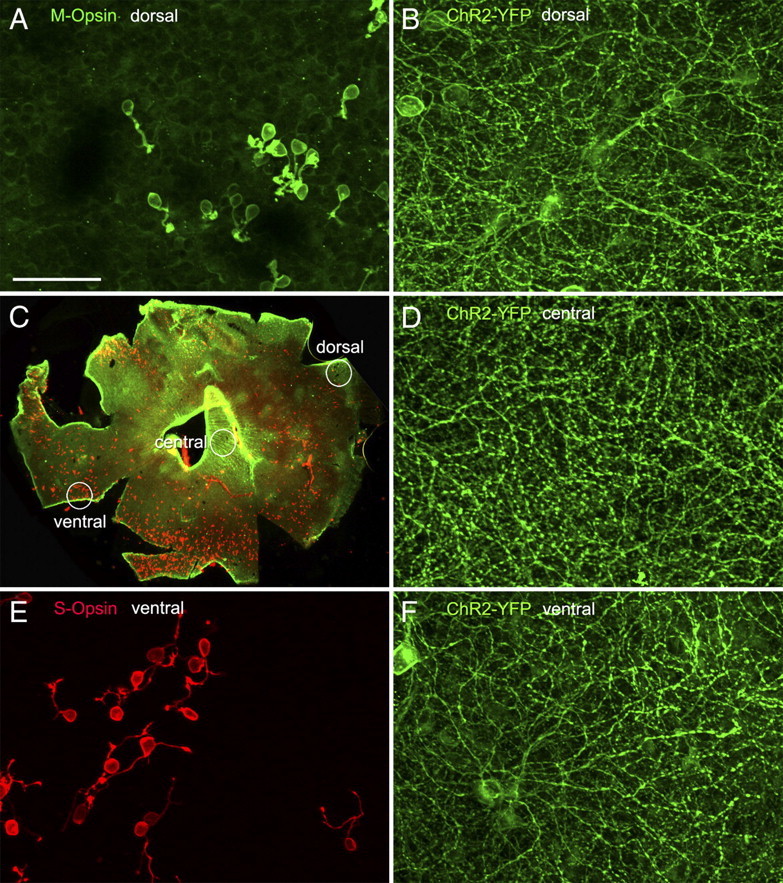
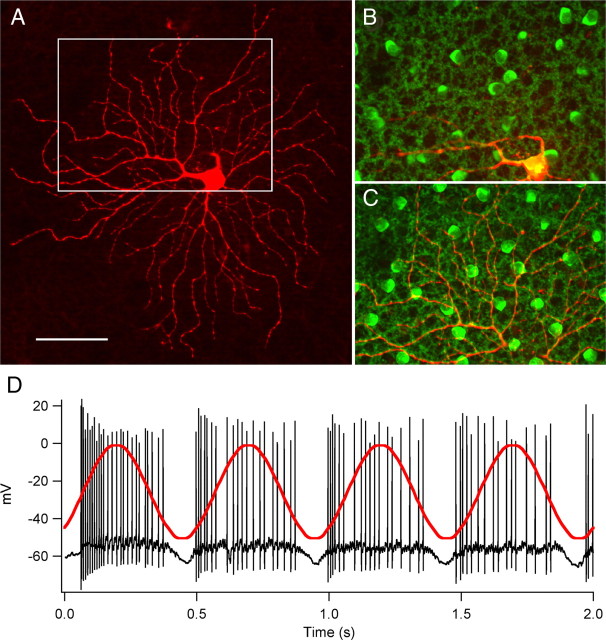
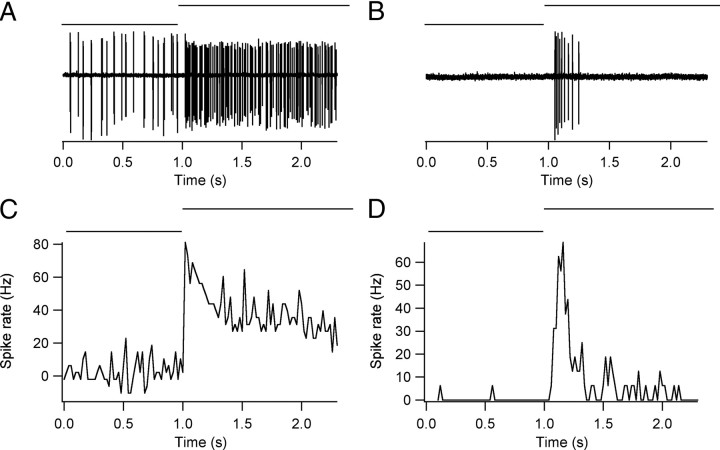
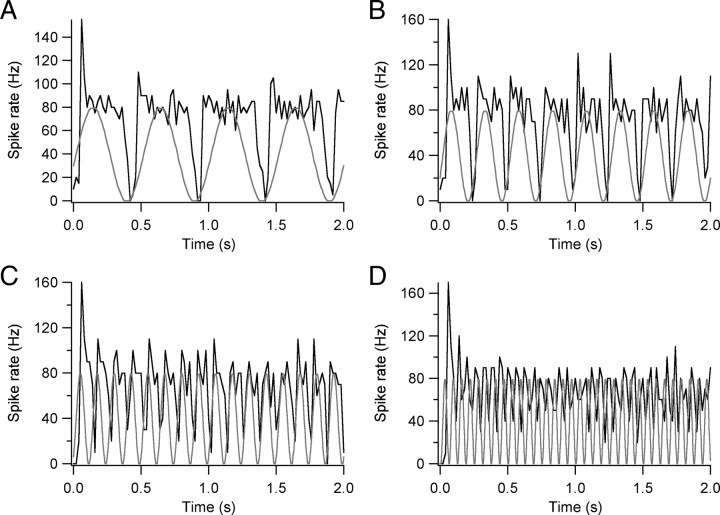
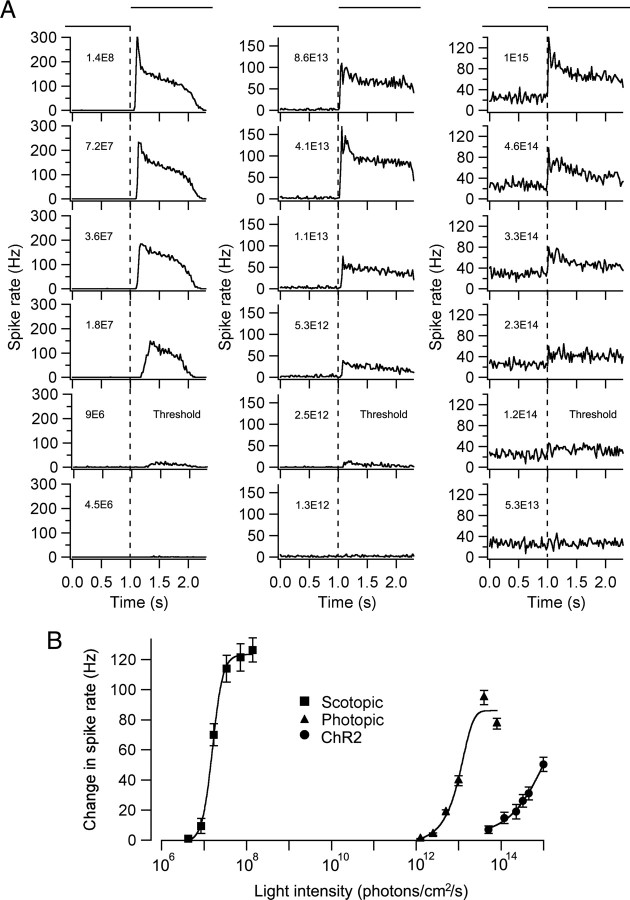
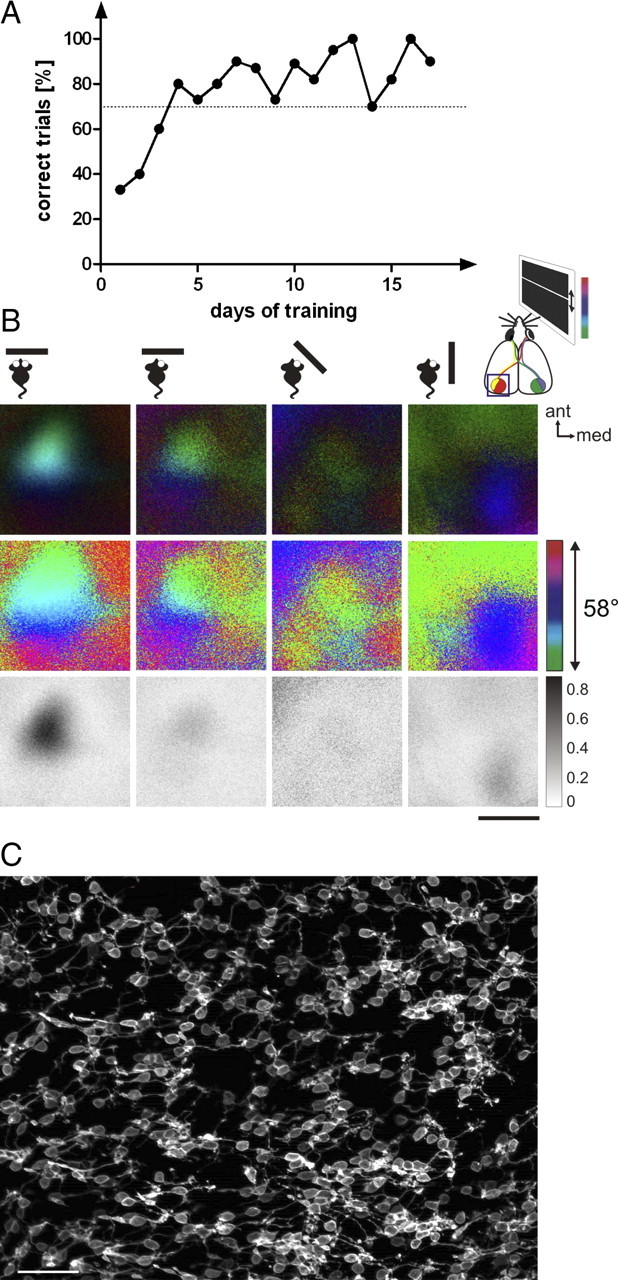
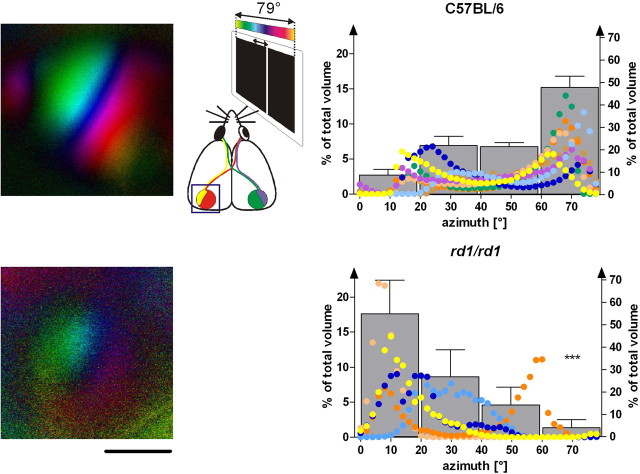
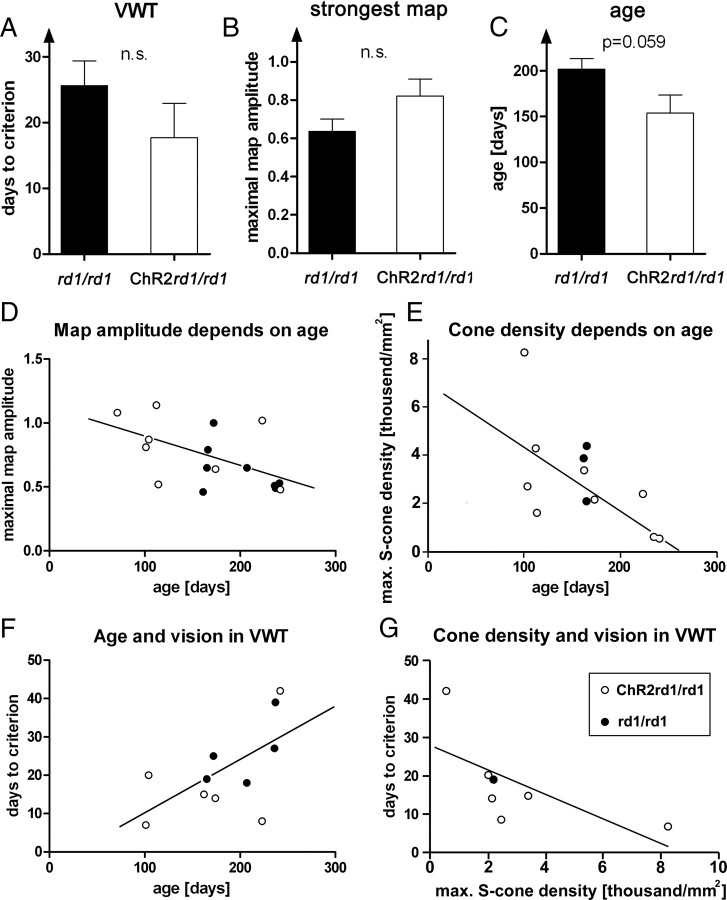
The progression of rod and cone degeneration in retinally degenerate (rd) mice ultimately results in a complete loss of photoreceptors and blindness. The inner retinal neurons survive and several recent studies using genetically targeted, light activated channels have made these neurons intrinsically light sensitive. We crossbred a transgenic mouse line expressing channelrhodopsin2 (ChR2) under the control of the Thy1 promoter with the Pde6b(rd1) mouse, a model for retinal degeneration (rd1/rd1). Approximately 30-40% of the ganglion cells of the offspring expressed ChR2. Extracellular recordings from ChR2-expressing ganglion cells in degenerated retinas revealed their intrinsic light sensitivity which was approximately 7 log U less sensitive than the scotopic threshold and approximately 2 log U less sensitive than photopic responses of normal mice. All ChR2-expressing ganglion cells were excited at light ON. The visual performance of rd1/rd1 mice and ChR2 rd1/rd1 mice was compared. Behavioral tests showed that both mouse strains had a pupil light reflex and they were able to discriminate light fields from dark fields in the visual water task. Cortical activity maps were recorded with optical imaging. The ChR2rd1/rd1 mice did not show a better visual performance than rd1/rd1 mice. In both strains the residual vision was correlated with the density of cones surviving in the peripheral retina. The expression of ChR2 under the control of the Thy1 promoter in retinal ganglion cells does not rescue vision.


Figures

Figure 1.
Figure 1.
Expression of ChR2-YFP in the mouse retina. A, Vertical section through the mouse retina. The retinal layers are visible in this Nomarski micrograph. ChR2-YFP immunofluorescence (green) is expressed in ganglion cells and their dendrites in both the OFF- and ON-sublayers of the IPL. B, Endogenous fluorescence of ChR2-YFP in a retinal whole mount. Ganglion cell bodies and axons are labeled. C, ChR2-YFP immunofluorescence in a retinal whole mount. Ganglion cells of different cell body sizes and dendritic morphologies are apparent. OPL, outer plexiform layer. Scale bar (in B): A, C, 50 μm; B, 150 μm .
Figure 2.
Figure 2.
Approximately one third of the ganglion cells in our ChR2rd1/rd1 mice express ChR2-YFP. A, Retinal whole mount double immunolabeled for ChR2-YFP (green) and ChAT (red). ChAT-immunoreactive amacrine cells do not express ChR2-YFP. B, Same field as in A, counterstained for cresyl violet. Many more ganglion cells and displaced amacrine cells become apparent. C, Superposition of A and B. From such material the percentage of labeled ganglion cell could be defined. Scale bar, 50 μm.
Figure 3.
Figure 3.
Expression of S-opsin, M-opsin and ChR2-YFP in the wild-type and rd1/rd1 mouse retina. A, Vertical section through the ventral retina of a wild-type mouse. S-opsin (red) and M-opsin (green) are expressed in the OS and IS of cones. Many cones express both opsins (yellow). Expression of ChR2-YFP is confined to ganglion cells, their dendrites in the IPL, and their axons in the NFL. B, Vertical section through the peripheral retina of a ChR2rd1/rd1 mouse (PND 314). The PE is immediately adjacent to the INL and the photoreceptor layers (ONL, IS, and OS) are completely degenerated. A few cells expressing S-opsin (red) are found at the INL/PE border. ChR2-YFP (green) is expressed in ganglion cells, their dendrites in the IPL and their axons in the NFL. Scale bar, 50 μm.
Figure 4.
Figure 4.
Expression of S-opsin, M-opsin and ChR2-YFP in a whole mount of a ChR2rd1/rd1 mouse retina (PND 235). C, Low-power map of the whole mount. At this magnification only the S-opsin expression (red) can be detected. The density of surviving, S-opsin-expressing cones is highest in the ventral retina. In the central retina no cones are left. Three fields (dorsal, ventral and central) are indicated by the circles and micrographs from these fields are shown at higher magnification in A, B (dorsal), E, F (ventral), and D (central). A, M-opsin expression in rudimentary cones of the dorsal retina. B, ChR2-YFP expression in the IPL/GCL of the same field as in A. D, No cones are present in this field, however, ChR2-YFP is expressed in the ganglion cells. E, S-opsin expression in rudimentary cones of the ventral retina. F, ChR2-YFP expression in the IPL/GCL of the same field as in E. Scale bar (in A): A, B, D–F, 50 μm; C, 1 mm.
Figure 5.
Figure 5.
Light responses of a ganglion cell with OFF-transient morphology recorded in the central retina of a ChR2rd1/rd1 mouse. A, Whole mount of the retina showing the dendritic tree of the recorded cell, filled with Lucifer yellow after the recordings. The area indicated by the white rectangle is shown at higher magnification in B and C (scale bar, 50 μm in A). The retina was also immunostained for ChAT and the cholinergic cell bodies and their dendrites in the OFF- and ON-stratum of the IPL became apparent. B, This micrograph shows a collapsed stack of confocal sections from the cell bodies of ChAT cells in the ganglion cell layer until the center of the IPL. The dendrites of the filled cell are not in focus. C, This micrograph shows a collapsed stack of confocal sections from the center of the IPL until the cell bodies of ChAT cells in the amacrine cell layer. The dendrites of the ganglion cells are within this stack and, therefore, stratify in the OFF-sublamina of the IPL. D, Spike-responses of this cell to a sinusoidally modulated light spot. The cell fires at light ON, although it has an OFF-morphology.
Figure 6.
Figure 6.
Light responses of ganglion cells recorded in the central retina of a ChR2 rd1/rd1 mouse. A, This cell showed a short-latency, sustained increase of the firing rate in response to the light stimulus. B, This cell showed a short-latency, transient increase of the firing rate. C, A spike-time histogram (STH) showing the average light response of 6 sustained ganglion cells. D, A STH showing the average light response of 3 transient ganglion cells (stimulus intensity: Imax = 1 · 1015 photons/cm2/s; stimulus size: 120 μm).
Figure 7.
Figure 7.
Spike-time histograms of the light responses of a ganglion cell from the central retina of a ChR2 rd1/rd1 mouse. Light intensity was modulated in a sinusoidal fashion at 2 Hz (A), 4 Hz (B), 8 Hz (C), and 16 Hz (D; spot size 120 μm; intensity: Imax = 1 · 1015 photons/cm2/s).
Figure 8.
Figure 8.
Response functions of ganglion cells to light stimuli of increasing intensity. A, Left column, Average light response of 6 ON-sustained ganglion cells of the completely dark-adapted wild-type mouse retina. The stimulus intensity is indicated (photons/cm2/s), the spot size is 300 μm. The threshold is 9 · 106 photons/cm2/s. Middle column, Average light response of 7 ON-sustained ganglion cells of the light-adapted wild-type mouse retina. The threshold is Imax = 2.5 · 1012 photons/cm2/s (background illumination Imin = 5 · 1010 photons/cm2/s; spot size: 120 μm). Right column, Average light response of 7 ganglion cells of the light-adapted central retina of ChR2rd1/rd1 mice. The cells showed a maintained discharge and the threshold to elicit a response above this maintained discharge was Imax = 1.2 · 1014 photons/cm2/s (background illumination Imin = 2 · 1012 photons/cm2/s; spot size 120 μm). B, Intensity response functions calculated from the light responses in A (average discharge rate for the first second after the onset of the stimulus).
Figure 9.
Figure 9.
Test of visual performance, cortical activity maps and residual S-cone density of the same animal, a ChR2rd1/rd1 mouse, 223 d old. A, Learning curve of the discrimination of a bright field from a dark field in the VWT. After 4 d of training the mouse reached the criterion continuously (70% correct responses). B, Optical recording of the activity in the visual cortex of the same animal elicited by the up and down movement of a horizontal bar (see inset). The 4 positions of the stimulus screen and the stimulation conditions (binocular/monocular) are indicated on top and the evoked activities are shown underneath. Upper and middle row, Polar and phase map of the response (retinotopic map); bottom row, gray scale coded magnitude map of the visual cortical responses. The color code and the intensity code are indicated on the right. ant, anterior; med, medial. Scale bar, 1 mm. C, Immunostaining of the residual cones in the ventral retina of the same animal for S-opsin. Their peak density was 2431 cones/mm2. Scale bar, 50 μm.
Figure 10.
Figure 10.
Dependence of cortical activity on azimuthal position of the visual stimulus. Response strength of visual cortex to vertical moving stimuli covering 0° to 79° of visual field in azimuth (inset), displayed in steps of 2° (dot plots, left axis) or 20° (column plots, right axis) azimuth, and expressed as percentage of total map volume. Data of eight C57BL/6 mice (top), age-matched to three rd1/rd1 (yellowish colors) and two ChR2rd1/rd1 (blue colors) are illustrated. In both panels, the yellow dotted line shows the quantification of the representative polar map illustrated on the left. Note that cortical activity declined from visual field position 0° (stimulating the peripheral/temporal retina) toward 79° (stimulating the central retina near the optic disk) in rd1/rd1 mice so that the representation of the central retinal field in rd1/rd1 mice is highly significantly weaker than in C57BL/6 mice (p < 0.001, Bonferroni-corrected t test). Scale bar, 1 mm.
Figure 11.
Figure 11.
Summary diagrams comparing the visual performance of rd1/rd1 and ChR2rd1/rd1 mice. A, Discrimination of light and dark fields in the VWT. A total of 9 rd1/rd1 mice and 10 ChR2rd1/rd1 mice were tested. Of them, 5 rd1/rd1 mice and 6 ChR2rd1/rd1 mice reached the 70% criterion. The average time to reach the criterion and the SD are shown in the bar diagram. B, Strongest map of the cortical response after visual stimulation, expressed as fractional change in reflectance ×104. Average of 8 rd1/rd1 and 8 ChR2rd1/rd1 mice. C, Average age of the mice (9 rd1/rd1 mice, 10 ChR2rd1/rd1 mice) at the optical imaging experiment. D, Scatter diagram comparing the age of the mice and the maximum map amplitude. The line shows a linear regression fitted to the data. E, Scatter diagram comparing the maximum S-cone density in the peripheral ventral retina and the age of the animals. There is considerable variation of the cone density for the different age groups. The linear regression line indicates that the residual cone density decreases with animal age. F, Scatter diagram comparing visual performance, i.e., the training days needed to reach the 70% criterion in the VWT and the age of the animals. The line shows a linear regression. G, Scatter diagram comparing the residual S-cone density and the days to reach the 70% criterion in the VWT.

Comment in

Similar articles

Cited by

References

    1. Arenkiel BR, Peca J, Davison IG, Feliciano C, Deisseroth K, Augustine GJ, Ehlers MD, Feng G. In vivo light-induced activation of neural circuitry in transgenic mice expressing channelrhodopsin-2. Neuron. 2007;54:205–218. - PMC - PubMed
    1. Berndt A, Yizhar O, Gunaydin LA, Hegemann P, Deisseroth K. Bi-stable neural state switches. Nat Neurosci. 2009;12:229–234. - PubMed
    1. Berson DM. Strange vision: ganglion cells as circadian photoreceptors. Trends Neurosci. 2003;26:314–320. - PubMed
    1. Berson DM, Dunn FA, Takao M. Phototransduction by retinal ganglion cells that set the circadian clock. Science. 2002;295:1070–1073. - PubMed
    1. Bi A, Cui J, Ma YP, Olshevskaya E, Pu M, Dizhoor AM, Pan ZH. Extopic expression of a microbial-type rhodopsin restores visual responses in mice with photoreceptor degeneration. Neuron. 2006;50:23–33. - PMC - PubMed

MeSH terms

Substances