. 2010 Jun 30;30(26):8787-96.
doi: 10.1523/JNEUROSCI.0208-10.2010.

Associative plasticity in the medial auditory thalamus and cerebellar interpositus nucleus during eyeblink conditioning

Affiliations

Associative plasticity in the medial auditory thalamus and cerebellar interpositus nucleus during eyeblink conditioning

Hunter E Halverson et al. J Neurosci. .

Abstract

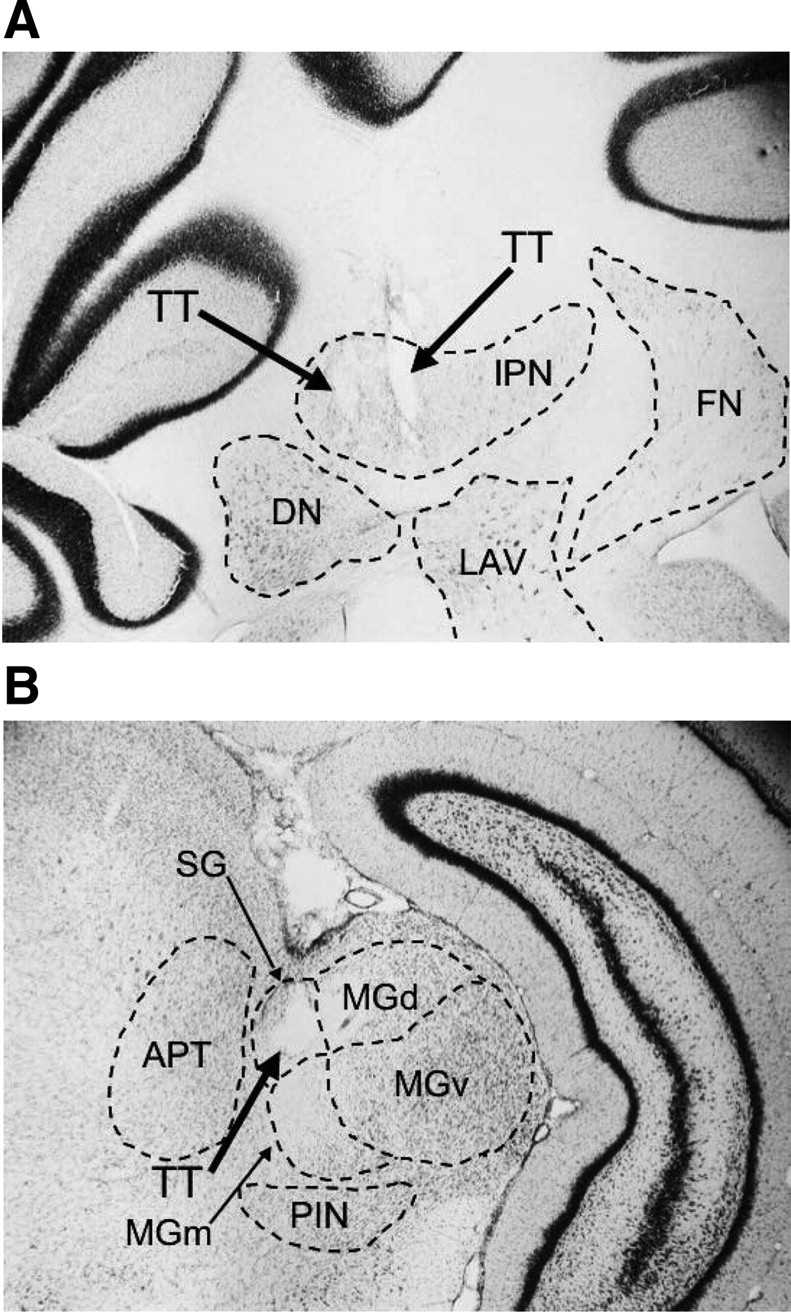
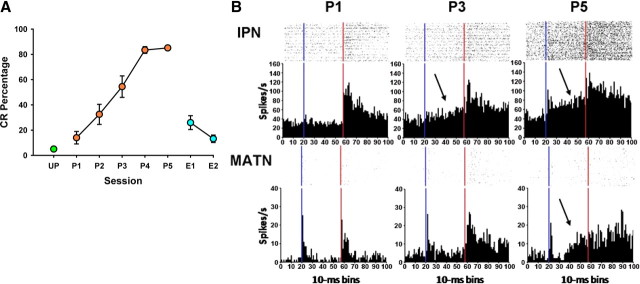
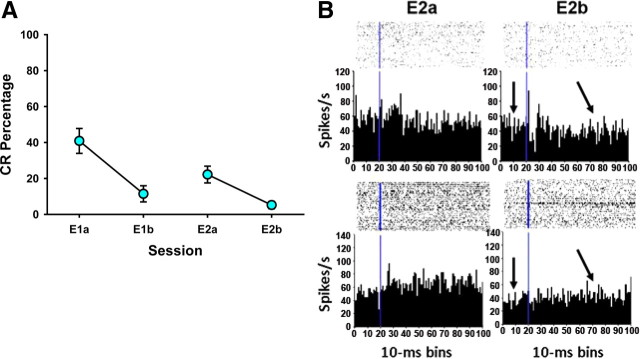
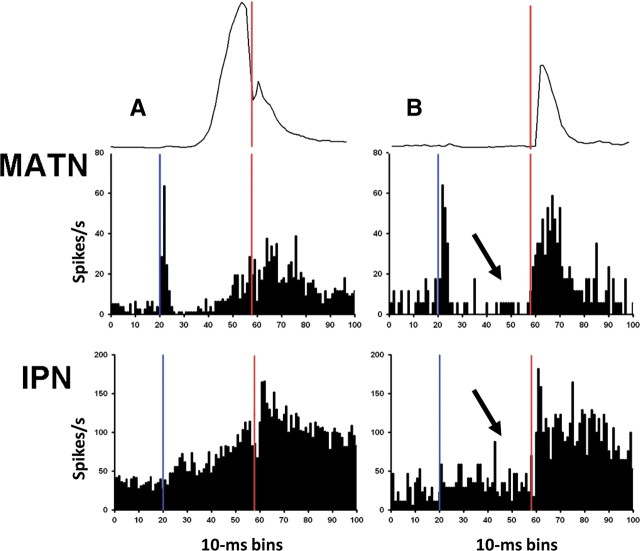
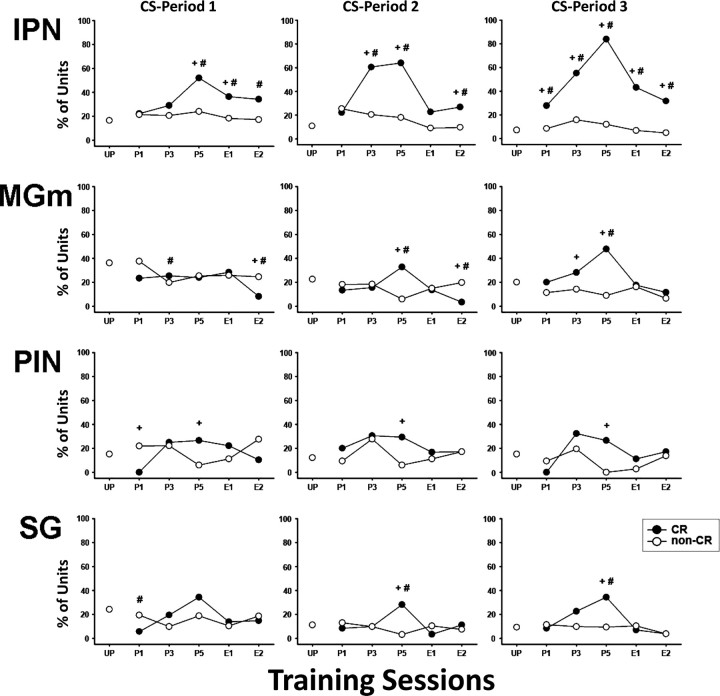
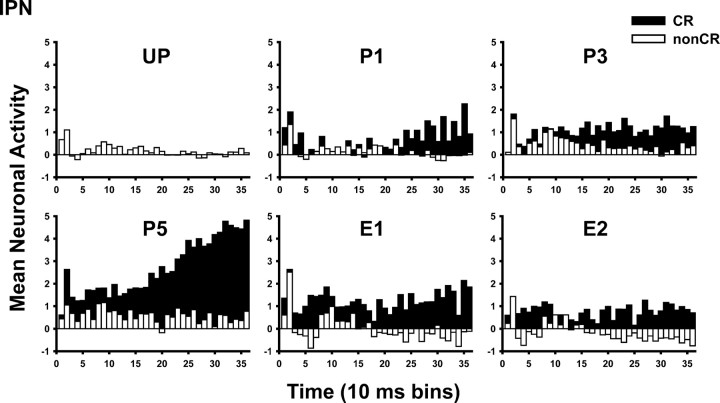
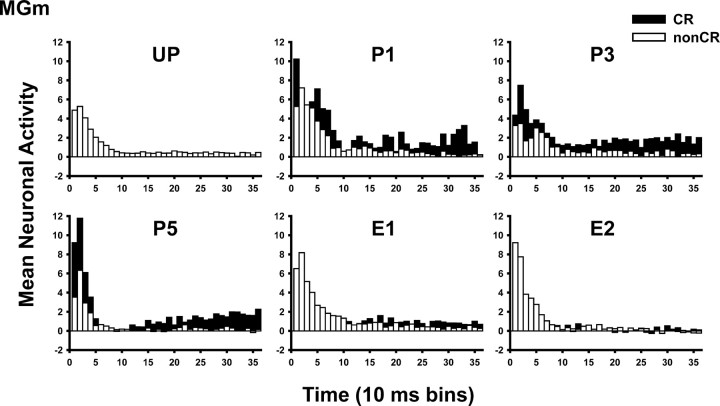
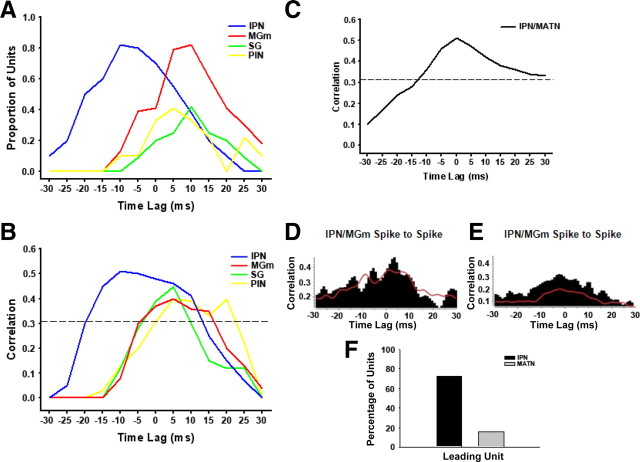
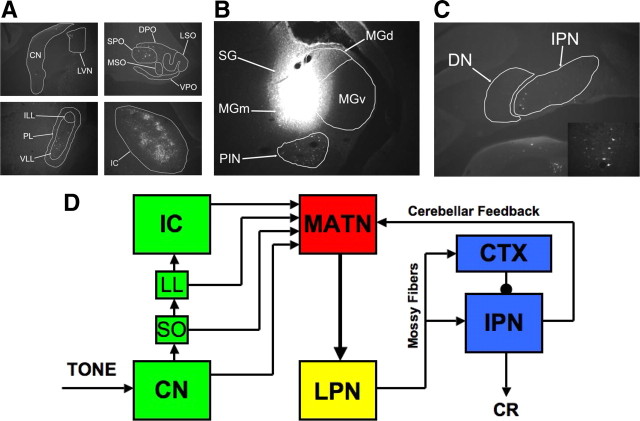
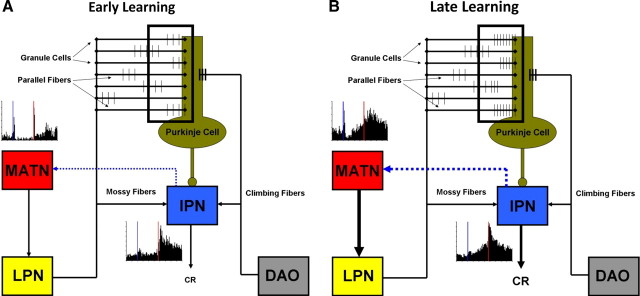
Eyeblink conditioning, a type of associative motor learning, requires the cerebellum. The medial auditory thalamus is a necessary source of stimulus input to the cerebellum during auditory eyeblink conditioning. Nothing is currently known about interactions between the thalamus and cerebellum during associative learning. In the current study, neuronal activity was recorded in the cerebellar interpositus nucleus and medial auditory thalamus simultaneously from multiple tetrodes during auditory eyeblink conditioning to examine the relative timing of learning-related plasticity within these interconnected areas. Learning-related changes in neuronal activity correlated with the eyeblink conditioned response were evident in the cerebellum before the medial auditory thalamus over the course of training and within conditioning trials, suggesting that thalamic plasticity may be driven by cerebellar feedback. Short-latency plasticity developed in the thalamus during the first conditioning session and may reflect attention to the conditioned stimulus. Extinction training resulted in a decrease in learning-related activity in both structures and an increase in inhibition within the cerebellum. A feedback projection from the cerebellar nuclei to the medial auditory thalamus was identified, which may play a role in learning by facilitating stimulus input to the cerebellum via the thalamo-pontine projection.


Figures

Figure 1.
Figure 1.
A, Coronal section of the cerebellum showing tetrode placements in the anterior IPN. An additional tetrode immediately posterior to the right tetrode contributed to the size of the marking lesion. DN, Dentate nucleus; FN, fastigial nucleus; LAV, lateral vestibular nucleus; TT, tetrode tip. Magnification, 2.5×. B, Coronal section of the thalamus showing a representative tetrode placement in the MATN (SG). APT, Anterior pretectal nucleus; MGd, dorsal division of the medial geniculate; MGv, ventral division of the medial geniculate; MGm, medial division of the medial geniculate; PIN, posterior intralaminar nucleus; SG, suprageniculate; TT, tetrode tip. Magnification, 2.5×.
Figure 2.
Figure 2.
A, Mean ± SE; CR percentage for rats during each session of training. UP, Unpaired (green); P1–P5, paired 1–5 (orange); E1–E2, extinction (teal). B, Histograms with raster plots of single unit activity (spikes/second) in anterior IPN and MATN during the first paired (P1), third paired (P3), and fifth paired (P5) sessions. Learning-related unit activity (arrows) increased in the IPN from P1 to P5. Learning-related unit activity is evident in the MATN on P5. The blue line represents CS onset, and the red line represents US onset. The bars in the histograms are 10 ms.
Figure 3.
Figure 3.
A, Mean ± SE; CR percentage for rats during extinction sessions. E1a, E2a, First 50 trials; E1b, E2b, last 50 trials. B, Histograms with raster plots of unit activity (spikes/second) for two anterior interpositus nucleus units during E2a,b. Both units showed a progressive decrease in pre-CS baseline (arrows) during extinction. Both units also showed an increase in inhibitory responses during the CS period on E2 (arrows). Each row follows a single IPN unit through E2. The blue line represents CS onset. The bars in the histograms are 10 ms.
Figure 4.
Figure 4.
Histograms with average EMG and corresponding single-unit responses (spikes/second) in MATN and anterior IPN during the last paired session (P5) on CR and non-CR trials. The left column (A) shows single-unit activity in the MATN and IPN during CR trials showing an increase in the IPN unit before onset of the behavioral CR (EMG trace). The right column (B) shows activity of the same units in MATN and IPN during non-CR trials showing the loss of learning-related activity (arrows). The blue line represents CS onset, and the red line represents US onset. The bars in the histograms are 10 ms.
Figure 5.
Figure 5.
Percentage of single units in the anterior IPN and MATN showing significant increases, relative to pre-CS baseline, during CR trials (black) and non-CR trials (white) for the three CS periods during the unpaired session (UP), first (P1), third (P3), and fifth (P5) paired sessions, and two extinction sessions (E1, E2). +Significant differences between CR and non-CR trials; #percentage is different from UP level.
Figure 6.
Figure 6.
Mean normalized unit activity recorded from the anterior IPN during the unpaired session (UP), first paired (P1), third paired (P3), fifth paired (P5), first extinction (E1), and second extinction (E2) sessions for trials with and without an eyeblink CR.
Figure 7.
Figure 7.
Mean normalized unit activity recorded from the MGm during the unpaired session (UP), first paired (P1), third paired (P3), fifth paired (P5), first extinction (E1), and second extinction (E2) sessions for trials with and without an eyeblink CR.
Figure 8.
Figure 8.
A, Line graph showing the proportion of units that showed significant cross-correlations with EMG activity time locked to CR onset (0 time lag) at different time lags in the anterior IPN (blue), MGm (red), SG (green), and PIN (yellow). There was a greater proportion of IPN units with positive correlations at earlier time lags relative to each area of MATN. B, Line graph showing cross-correlations between average unit activity in the IPN and each area of MATN with average eyelid EMG activity time-locked to the onset of the CR for CS-alone trials in which a CR was performed during P5. Significant correlations (dotted line) for the population of IPN units showed a negative time lag of −18 ms, with the highest correlations between −12 and −10 ms, indicating IPN units showed an increase in activity before the onset of the CR. Significant positive correlations for the population of units for each area of MATN showed a negative time lag of −5 ms indicating that MATN units fire just before the onset of the CR. The highest correlations were between time lags 5–10 ms after CR onset. C, Line graph showing cross-correlation between average learning-related unit activity in IPN and learning-related activity from each area of MATN time-locked to the onset of the CR. The highest significant correlations (dotted line) were between −5 ms and CR onset (time lag, 0). D, E, Examples of spike-to-spike cross-correlations for individual simultaneously recorded units in MGm and IPN on P5 (0, CR onset; MGm unit as reference). The highest correlations were before and immediately after CR onset as observed with the population analysis. The red line indicates the shift predictor for the MGm unit relative to the IPN unit in each case. F, Bar graph showing the percentage of units in IPN or MATN showing cross-correlations with the earliest lead times relative to CR onset when considering all possible combinations of simultaneously recorded units within animals.
Figure 9.
Figure 9.
A, Coronal section of the lower brainstem and inferior colliculus (IC) showing labeled neurons in the cochlear nucleus (CN), lateral vestibular nucleus (LVN), dorsal periolivary region (DPO), medial superior olive (MSO), ventral periolivary nucleus (VPO), ventral nucleus of the lateral lemniscus (VLL), intermediate nucleus of the lateral lemniscus (ILL), and throughout the IC. LSO, Lateral superior olive; SPO, superior periolivary nucleus; DLL, dorsal nucleus of the lateral lemniscus. Magnification, 4×. B, Coronal section of the auditory thalamus showing the Fluoro-Gold infusion site. Labeled neurons are shown in the PIN. SG, Suprageniculate; MGm, medial division of the medial geniculate; MGd, dorsal division of the medial geniculate; MGv, ventral division of the medial geniculate. Magnification, 4×. C, Coronal section of the cerebellum showing labeled neurons in the lateral portion of the anterior interpositus (IPN). Fluoro-Gold infusions in the anterior MATN produced labeled neurons in IPN, and infusions into posterior MATN produced labeled neurons in the dentate nucleus. Labeled neurons were contralateral to the infusion sites. Magnification, 4× and 20× for close-up of neurons. D, Hypothesized auditory CS pathway for eyeblink conditioning. Parallel inputs into the MATN from cochlear nucleus (CN), superior olive (SO), lateral lemniscus (LL), and inferior colliculus (IC). Auditory input is then projected to lateral pontine nuclei (LPN), which project to the cerebellum (cortex and interpositus nucleus). A feedback projection from the IPN to the MATN is also shown.
Figure 10.
Figure 10.
Hypothesized role of medial auditory thalamic plasticity in cerebellar learning. A, Paired stimulus inputs from the lateral pontine nuclei (LPN) and dorsal accessory inferior olive (DAO) on Purkinje cells in the cerebellar cortex during the early stages of eyeblink conditioning. Learning is initiated by CS activated parallel fibers that arrive at Purkinje cells nearly simultaneously with climbing fiber input (window). No learning-related plasticity is evident in the anterior IPN or MATN during the initial training trials. B, Paired stimulus inputs from the LPN and DAO on Purkinje cells after conditioned responding starts to emerge. Learning is potentiated by an increase (relative to initial training) in the frequency of parallel fiber activity at Purkinje cells that occurs nearly simultaneously with climbing fiber input (window). Clear learning-related plasticity is evident in IPN and MATN during this later stage of learning. An increase in learning-related excitatory cerebellar feedback to the MATN (blue dotted line) may in turn increase the MATN output to LPN and the corresponding mossy fiber projection into the cerebellum to further facilitate learning.

Similar articles

Cited by

References

    1. Bajo VM, Merchán MA, López DE, Rouiller EM. Neuronal morphology and efferent projections of the dorsal nucleus of the lateral lemniscus in the rat. J Comp Neurol. 1993;334:241–262. - PubMed
    1. Bao S, Chen L, Thompson RF. Learning- and cerebellum-dependent neuronal activity in the lateral pontine nucleus. Behav Neurosci. 2000;114:254–261. - PubMed
    1. Berthier NE, Moore JW. Activity of deep cerebellar nucleus cells during classical conditioning of nictitating membrane extension in rabbits. Exp Brain Res. 1990;83:44–54. - PubMed
    1. Blum PS, Gilman S. Vestibular, somatosensory, and auditory input to the thalamus of the cat. Exp Neurol. 1979;65:343–354. - PubMed
    1. Bordi F, LeDoux JE. Response properties of single units in areas of rat auditory thalamus that project to the amygdala. Exp Brain Res. 1994;98:275–286. - PubMed

Publication types

MeSH terms

LinkOut - more resources