

The genetic architecture of grain yield and related traits in Zea maize L. revealed by comparing intermated and conventional populations
- PMID: 20592258
- PMCID: PMC2940303
- DOI: 10.1534/genetics.110.113878
The genetic architecture of grain yield and related traits in Zea maize L. revealed by comparing intermated and conventional populations
Abstract
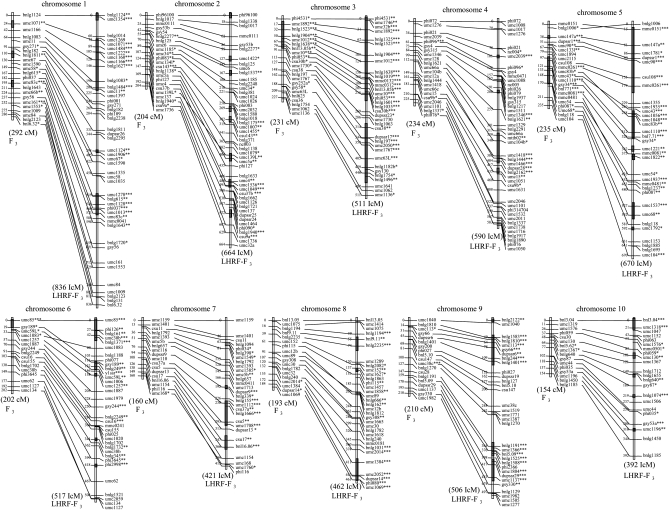
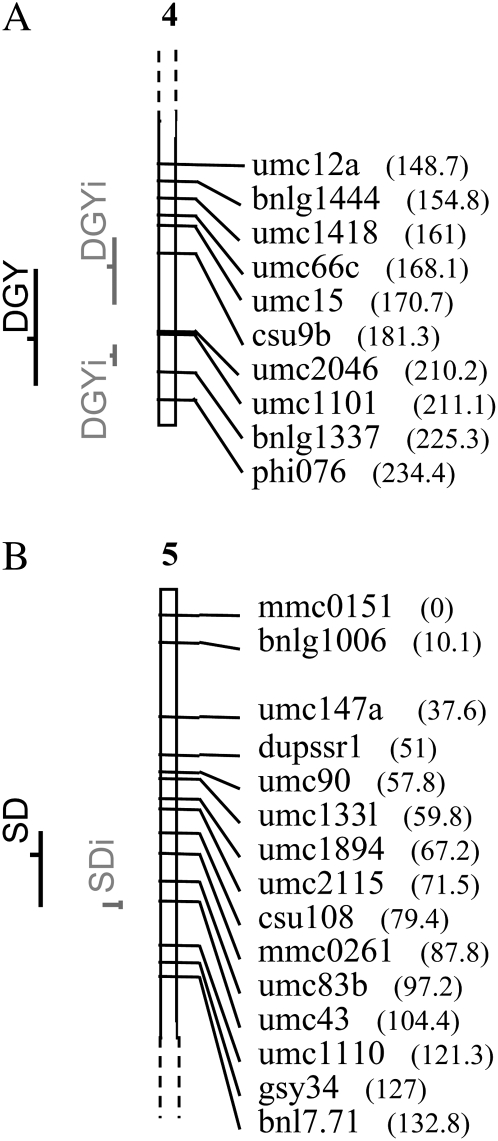
Using advanced intermated populations has been proposed as a way to increase the accuracy of mapping experiments. An F(3) population of 300 lines and an advanced intermated F(3) population of 322 lines, both derived from the same parental maize inbred lines, were jointly evaluated for dry grain yield (DGY), grain moisture (GM), and silking date (SD). Genetic variance for dry grain yield was significantly lower in the intermated population compared to the F(3) population. The confidence interval around a QTL was on average 2.31 times smaller in the intermated population compared to the F(3) population. One controversy surrounding QTL mapping is whether QTL identified in fact represent single loci. This study identifies two distinct loci for dry grain yield in the intermated population in coupling phase, while the F(3) identifies only a single locus. Surprisingly, fewer QTL were detected in the intermated population than the F(3) (21 vs. 30) and <50% of the detected QTL were shared among the two populations. Cross-validation showed that selection bias was more important in the intermated population than in the F(3) and that each detected QTL explained a lower percentage of the variance. This finding supports the hypothesis that QTL detected in conventional populations correspond mainly to clusters of linked QTL. The actual number of QTL involved in the genetic architecture of complex traits may be substantially larger, with effect sizes substantially smaller than in conventional populations.
Figures
References
-
- Arcade, A., A. Labourdette, M. Falque, B. Mangin, F. Chardon et al., 2004. BioMercator: integrating genetic maps and QTL towards discovery of candidate genes. Bioinformatics 20 2324–2326. - PubMed
-
- Balint-Kurti, P. J., J. C. Zwonitzer, R. J. Wisser, M. L. Carson, M. A. Oropeza-Rosas et al., 2007. Precise mapping of quantitative trait loci for resistance to southern leaf blight, caused by Cochliobolus heterostrophus race O, and flowering time using advanced intercross maize lines. Genetics 176 645–657. - PMC - PubMed
-
- Balint-Kurti, P. J., R. Wisser and J. C. Zwonitzer, 2008. Use of an advanced intercross line population for precise mapping of quantitative trait loci for gray leaf spot resistance in maize. Crop Sci. 48 1696–1704.
-
- Bartlett, M. S., 1937. Properties of sufficiency and statistical tests. Proc. R. Stat. Soc. Ser. A 160 268–282.
-
- Beavis, W. D., 1994. The power and deceit of QTL experiments: lessons from comparative QTL studies. 49th Annual Corn and Sorghum Industry Research Conference. ASTA, Washington, DC, pp. 250–266.
Publication types
MeSH terms
Substances
LinkOut - more resources
Full Text Sources
Miscellaneous
