. 2010 Sep;186(1):321-38.
doi: 10.1534/genetics.110.117986. Epub 2010 Jun 30.

A principled approach to deriving approximate conditional sampling distributions in population genetics models with recombination

Affiliations

A principled approach to deriving approximate conditional sampling distributions in population genetics models with recombination

Joshua S Paul et al. Genetics. 2010 Sep.

Abstract

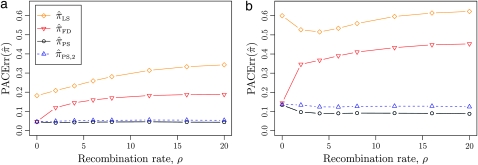
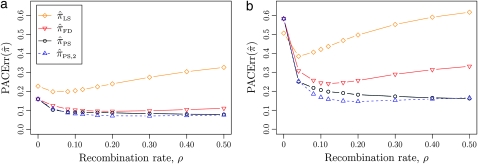
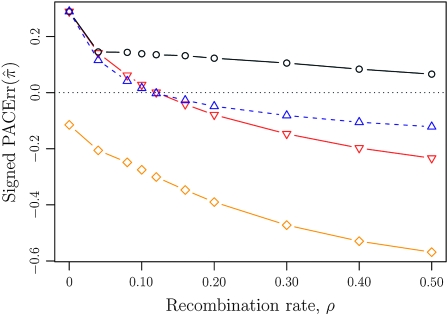
The multilocus conditional sampling distribution (CSD) describes the probability that an additionally sampled DNA sequence is of a certain type, given that a collection of sequences has already been observed. The CSD has a wide range of applications in both computational biology and population genomics analysis, including phasing genotype data into haplotype data, imputing missing data, estimating recombination rates, inferring local ancestry in admixed populations, and importance sampling of coalescent genealogies. Unfortunately, the true CSD under the coalescent with recombination is not known, so approximations, formulated as hidden Markov models, have been proposed in the past. These approximations have led to a number of useful statistical tools, but it is important to recognize that they were not derived from, though were certainly motivated by, principles underlying the coalescent process. The goal of this article is to develop a principled approach to derive improved CSDs directly from the underlying population genetics model. Our approach is based on the diffusion process approximation and the resulting mathematical expressions admit intuitive genealogical interpretations, which we utilize to introduce further approximations and make our method scalable in the number of loci. The general algorithm presented here applies to an arbitrary number of loci and an arbitrary finite-alleles recurrent mutation model. Empirical results are provided to demonstrate that our new CSDs are in general substantially more accurate than previously proposed approximations.


Figures

F<sc>igure</sc> 1.—
Figure 1.—
Illustrations of a genealogy and conditional genealogy for a two-locus (k = 2), two-allele model. The two loci of a haplotype are each represented by a circle, with the shading (light or dark) indicating the allelic type at that locus. Mutation events, along with the locus and resulting haplotype, are indicated by small arrows. Recombination events (always taking the left loci from the left side and the right locus from the right side), along with the resulting haplotype, are indicated by dotted circles. (a) A genealogy formula image with n = 4. It is easy to verify that, starting with the MRCA and following the genealogy forward in time, the sample configuration n shown at the leaves is obtained. (b) An “observed” genealogy formula image with n = 3 and a conditional genealogy formula image with m = 1. Absorption events are indicated by dotted arrows into formula image. Following the combined genealogy forward in time, it is easy to check that the conditional sample m shown at the leaf of formula image is obtained.
F<sc>igure</sc> 2.—
Figure 2.—
Illustration of a conditional genealogy using the approximation formula image. Absorption events are indicated by dotted arrows into the “trunk” ancestry formula image. Comparing with Figure 1b, observe that formula image is time invariant and extends infinitely into the past.
F<sc>igure</sc> 3.—
Figure 3.—
Relative error of CSDs for θ0 = 1 and ρ0 = 4. See (14) for definition of formula image. With θ0 = 1 and ρ0 = 4, we used a coalescent simulator to generate 250 data sets, each with 25 haplotypes and 10 loci. Then, requisite k-locus, n-haplotype conditional configurations {C(i)}i=1, …, 250 were obtained using method M1 described in the text. (a) k ∈ {2, 3, 4, 5, 6, 8, 10}, n = 6, and ρ = ρ0. (b) k = 4, n = 6, and ρ ∈ {0, 2, 4, 6, 8, 12, 16, 20}. (c) k = 4, n ∈ {2, 4, 6, 8, 10, 14, 20}, and ρ = ρ0.
F<sc>igure</sc> 4.—
Figure 4.—
Relative error of CSDs for θ0 = 0.01 and ρ0 = 0.1. See (14) for definition of formula image. With θ0 = 0.01 and ρ0 = 0.1, we used a coalescent simulator to generate 250 data sets, each with 25 haplotypes and 500 loci. Then, requisite k-locus n-haplotype conditional configurations {C(i)}i=1, …, 250 were obtained using method M2 described in the text. (a) k ∈ {2, 3, 4, 5, 6, 8, 10}, n = 6, and ρ = ρ0. (b) k = 4, n = 6, and ρ ∈ {0, 4, 8, 12, 16, 20, 30, 40, 50} × 10−2. (c) k = 4, n ∈ {2, 4, 6, 8, 10, 14, 20}, and ρ = ρ0.
F<sc>igure</sc> 5.—
Figure 5.—
Relative error of PAC likelihoods for θ0 = 1 and ρ0 = 4. See (15) for definition of formula image. With θ0 = 1 and ρ0 = 4, we used a coalescent simulator to generate 250 data sets, each with 25 haplotypes and 10 loci. Then, requisite k-locus n-haplotype configurations {n(i)}i=1, …, 250 were obtained using method M1 described in the text. (a) k = 3, n = 25, and ρ ∈ {0, 2, 4, 6, 8, 12, 16, 20}. (b) k = 5, n = 25, and ρ ∈ {0, 2, 4, 6, 8, 12, 16, 20}.
F<sc>igure</sc> 6.—
Figure 6.—
Relative error of PAC likelihoods for θ0 = 0.01 and ρ0 = 0.1. See (15) for definition of formula image. With θ0 = 0.01 and ρ0 = 0.1, we used a coalescent simulator to generate 250 data sets, each with 25 haplotypes and 500 loci. Then, requisite k-locus n-haplotype configurations {n(i)}i=1, …, 250 were obtained using method M2 described in the text. (a) k = 3, n = 25, and ρ ∈ {0, 4, 8, 12, 16, 20, 30, 40, 50} × 10−2. (b) k = 5, n = 25, and ρ ∈ {0, 4, 8, 12, 16, 20, 30, 40, 50} × 10−2.
F<sc>igure</sc> 7.—
Figure 7.—
Approximate values of signed PACErr formula image for θ0 = 0.01 and ρ0 = 0.1, corresponding to Figure 6b. The correspondence between the symbols and formula image's is the same as in previous figures.

References

    1. Chen, G. K., P. Marjoram and J. D. Wall, 2009. Fast and flexible simulation of DNA sequence data. Genome Res. 19 136–142. - PMC - PubMed
    1. Crawford, D. C., T. Bhangale, N. Li, G. Hellenthal, M. J. Rieder et al., 2004. Evidence for substantial fine-scale variation in recombination rates across the human genome. Nat. Genet. 36 700–706. - PubMed
    1. Davison, D., J. K. Pritchard and G. Coop, 2009. An approximate likelihood for genetic data under a model with recombination and population splitting. Theor. Popul. Biol. 75(4): 331–345. - PMC - PubMed
    1. De Iorio, M., and R. C. Griffiths, 2004. a Importance sampling on coalescent histories I. Adv. Appl. Probab. 36 417–433.
    1. De Iorio, M., and R. C. Griffiths, 2004. b Importance sampling on coalescent histories II. Adv. Appl. Probab. 36 434–454.

Publication types