. 2010 Sep;186(1):295-308.
doi: 10.1534/genetics.110.113977. Epub 2010 Jun 30.

Natural selection and the distribution of identity-by-descent in the human genome

Affiliations

Natural selection and the distribution of identity-by-descent in the human genome

Anders Albrechtsen et al. Genetics. 2010 Sep.

Abstract

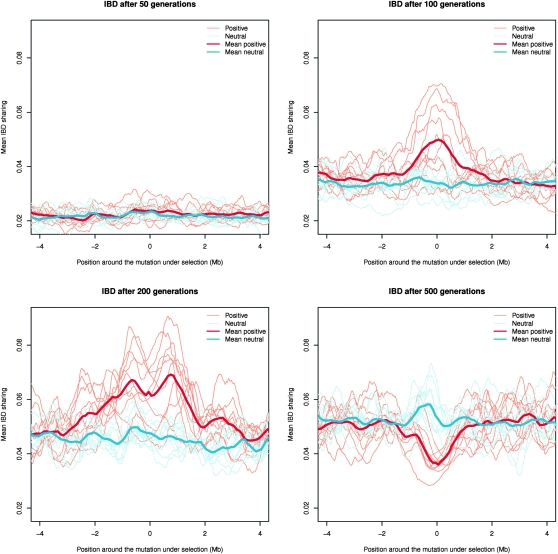
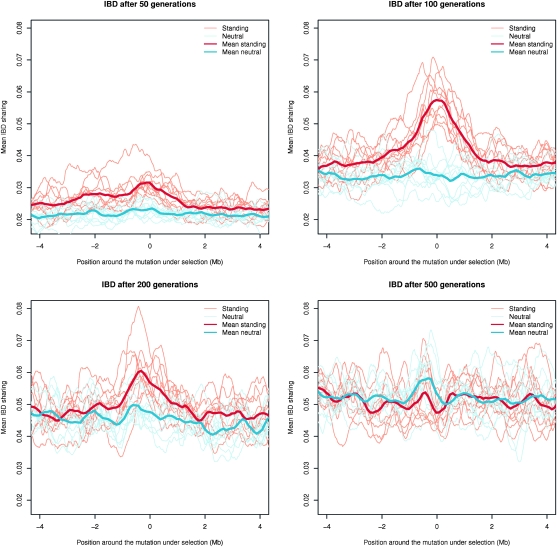
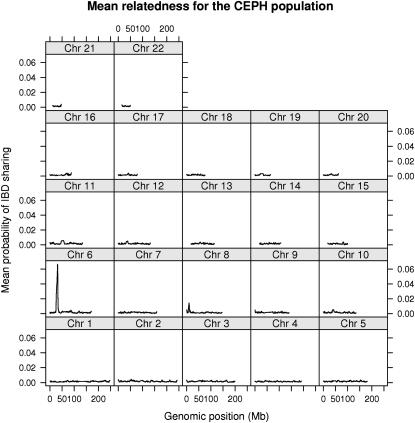
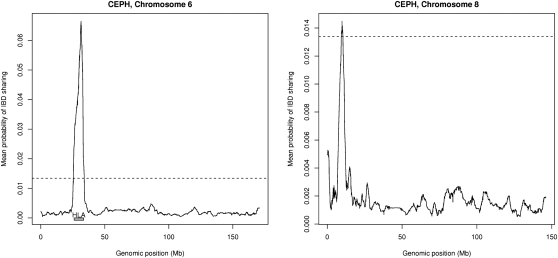
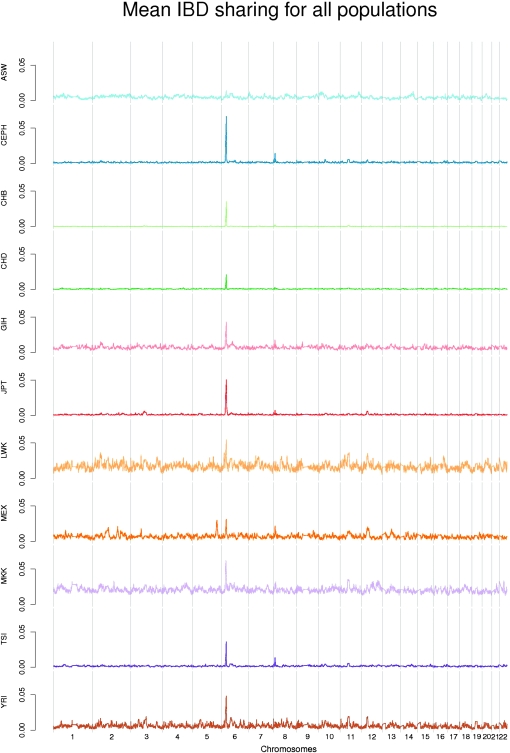
There has recently been considerable interest in detecting natural selection in the human genome. Selection will usually tend to increase identity-by-descent (IBD) among individuals in a population, and many methods for detecting recent and ongoing positive selection indirectly take advantage of this. In this article we show that excess IBD sharing is a general property of natural selection and we show that this fact makes it possible to detect several types of selection including a type that is otherwise difficult to detect: selection acting on standing genetic variation. Motivated by this, we use a recently developed method for identifying IBD sharing among individuals from genome-wide data to scan populations from the new HapMap phase 3 project for regions with excess IBD sharing in order to identify regions in the human genome that have been under strong, very recent selection. The HLA region is by far the region showing the most extreme signal, suggesting that much of the strong recent selection acting on the human genome has been immune related and acting on HLA loci. As equilibrium overdominance does not tend to increase IBD, we argue that this type of selection cannot explain our observations.


Figures

F<sc>igure</sc> 1.—
Figure 1.—
The deterministic approximation to the IBD sharing probability F(t) through 200 generations. The blue line is the IBD probability with selection (s = 0.1) on a new allele and the purple line is without selection. In both cases N = 10,000.
F<sc>igure</sc> 2.—
Figure 2.—
The deterministic approximation to the IBD sharing probability F(t) through 200 generations. The blue line is the IBD probability with selection (s = 0.1) on an existing allele of frequency of 1% and the purple line is without selection. In both cases N = 10, 000.
F<sc>igure</sc> 3.—
Figure 3.—
Simulation of positive selection on a new allele. Mean probability of IBD sharing is shown after 50, 100, 200, and 500 generations in simulations with strong positive selection (s = 0.1). Ten simulations were performed, each of a 10-Mb region. Only the region around the mutation is shown. For comparison the mean posterior probability of IBD sharing for simulations without selection are also shown. The neutral simulations were performed on the same haplotypes that were used as a starting point for the simulations with selection. The thin lines show each simulation while the thick lines shows the mean of the 10 simulations. The red lines are the simulations with selection and the blue lines the simulations without selection.
F<sc>igure</sc> 4.—
Figure 4.—
Simulation of positive selection on standing variation. Mean probability of IBD sharing is shown after 50, 100, 200, and 500 generations in simulations with strong positive selection (s = 0.1) on an existing allele of frequency 0.1. Ten simulations were performed, each of a 10-Mb region. Only the region around the mutation is shown. For comparison the mean posterior probability of IBD sharing for simulations without selection are also shown. The neutral simulations were performed on the same haplotypes that were used as a starting point for the simulations with selection. The thin lines show each simulation while the thick lines shows the mean of the 10 simulations. The red lines are the simulations with selection and the blue lines the simulations without selection.
F<sc>igure</sc> 5.—
Figure 5.—
IBD sharing in the CEPH population. Mean probability of IBD sharing among the 109 unrelated individuals in the HapMap phase 3 CEPH sample is shown for each of the autosomal chromosomes.
F<sc>igure</sc> 6.—
Figure 6.—
IBD sharing for chromosome 6 and 8 in the CEPH population. Mean probability of IBD sharing among the 109 unrelated individuals in the HapMap phase 3 CEPH sample is shown for chromosome 6 and chromosome 8. The horizontal dashed lines indicate the critical value achieved through coalescent simulations.
F<sc>igure</sc> 7.—
Figure 7.—
Mean probability of IBD sharing each of the HapMap 11 phase 3 populations. The chromosomes are separated by vertical lines.

References

    1. Akey, J. M., G. Zhang, K. Zhang, L. Jin and M. D. Shriver, 2002. Interrogating a high-density SNP map for signatures of natural selection. Genome Res. 12 1805–1814. - PMC - PubMed
    1. Albrechtsen, A., T. Sand Korneliussen, I. Moltke, T. van Overseem Hansen, F. C. Nielsen et al., 2009. Relatedness mapping and tracts of relatedness for genome-wide data in the presence of linkage disequilibrium. Genet. Epidemiol. 33 266–274. - PubMed
    1. Barrett, R. D., and D. Schluter, 2008. Adaptation from standing genetic variation. Trends Ecol. Evol. 23 38–44. - PubMed
    1. Bersaglieri, T., P. C. Sabeti, N. Patterson, T. Vanderploeg, S. F. Schaffner et al., 2004. Genetic signatures of strong recent positive selection at the lactase gene. Am. J. Hum. Genet. 74 1111–1120. - PMC - PubMed
    1. Bubb, K. L., D. Bovee, D. Buckley, E. Haugen, M. Kibukawa et al., 2006. Scan of human genome reveals no new Loci under ancient balancing selection. Genetics 173 2165–2177. - PMC - PubMed

Publication types