. 2010 Jun 30;2(38):38ra47.
doi: 10.1126/scitranslmed.3000611.

Genomic architecture characterizes tumor progression paths and fate in breast cancer patients

Affiliations

Genomic architecture characterizes tumor progression paths and fate in breast cancer patients

Hege G Russnes et al. Sci Transl Med. .

Abstract

Distinct molecular subtypes of breast carcinomas have been identified, but translation into clinical use has been limited. We have developed two platform-independent algorithms to explore genomic architectural distortion using array comparative genomic hybridization data to measure (i) whole-arm gains and losses [whole-arm aberration index (WAAI)] and (ii) complex rearrangements [complex arm aberration index (CAAI)]. By applying CAAI and WAAI to data from 595 breast cancer patients, we were able to separate the cases into eight subgroups with different distributions of genomic distortion. Within each subgroup data from expression analyses, sequencing and ploidy indicated that progression occurs along separate paths into more complex genotypes. Histological grade had prognostic impact only in the luminal-related groups, whereas the complexity identified by CAAI had an overall independent prognostic power. This study emphasizes the relation among structural genomic alterations, molecular subtype, and clinical behavior and shows that objective score of genomic complexity (CAAI) is an independent prognostic marker in breast cancer.


Figures

Figure 1
Figure 1. CAAI values compared to structural rearrangements identified by paired-end sequencing
A) Raw (dots) and segmented (line) data for chromosome arms 7p and 8q and chr.15 from sample 595. Red segments correspond to the 20 Mb windows with highest CAAI; the corresponding CAAI was 7.04, 1.04 and 4.74 respectively. Chromosome arm 7p had an additional region with high level CAAI, but as this score was lower than 7.04 it was not highlighted in red. B) Structural sequence alterations identified by genome wide paired-end sequencing for the same sample. Outer circle show the cytobands for each chromosome, followed by a plot indicating the copy number variation. The green bars in the centre refer to smaller intra-chromosomal changes such as duplications and inversions while pink lines indicate inter-chromosomal translocations. In this sample 13 chromosome arms had CAAI>0, six of these had CAAI≥0.5, these are in bold and marked with *. The two regions with most rearrangements showed the highest CAAI (chromosome arm 7p and chr.15). Areas with few rearrangements had low or zero CAAI.
Figure 2
Figure 2. WAAI and centromere close translocation
A) Plotted aCGH values for chromosome arm 1q and 16q from case WZ061; unsegmented data as blue points and PCF values as black line showed whole chromosome arm gain of 1q and loss of 16q. This was reflected in the estimated WAAI; WAAI= 1.221 for 1q and WAAI= −1.465 for 16q. B) Multi gene FISH analyses with four selected probes derived from centromere close BAC clones on chr.1 and chr.16 were hybridized to tumor cells (imprint) from WZ061. The image to the left show a tumor cell with all fluorescent probes superimposed revealing two green signals together, one orange and red and one green and orange (note that the probes will never be fused due to the large stretches of heterochromatin around the centromere). The figure to the right illustrates the combination of fluorochromes observed in nuclei from lymphocytes with non-translocated chr.1 and chr.16 and an illustration of the observed combination in the tumor cells probably demonstrating a translocation and a derivative chromosome; der(1;16)(10q;10p).
Figure 3
Figure 3. Genome wide distribution of genomic loss and gain compared to frequencies of WAAI and CAAI in 595 breast carcinomas
A) Frequency plot illustrating the percentage of samples with gain and loss genome wide (red: gain, green: loss). B) The frequency of samples scored with whole arm changes identified by WAAI and complex rearrangements scored by CAAI are shown in the heatmap. The color indicates the percentage arms with WAAI over and under the chosen threshold and the percentage of arms with CAAI higher than the threshold for each chromosome arm with: WAAI≥0.8 (red, top row), WAAI≤−0.8 (green, middle row) and CAAI≥0.5 (blue, bottom row). The plot illustrates the nonrandom distribution of different types of genomic events.
Figure 4
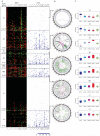
Figure 4. Genome wide distribution of WAAI and CAAI for all samples sorted into WAAI groups, examples of identified structural aberrations and corresponding gene expression patterns
A) The heatmap illustrates the WAAI and CAAI score for all 595 samples sorted into A, B, AB and C tumors and thereafter into groups of tumors with and without high level CAAI on one chromosome arm or more. The sample sizes of the eight groups are indicated. Each row in the heatmap corresponds to one sample, and each column to a chromosome arm (from 1p to 22). The left panel indicate WAAI alterations for each chromosome arm (red: WAAI≥0.8, green; WAAI≤−0.8, black: 0.8>WAAI<−0.8). The right panel indicate the corresponding CAAI score for each chromosome arm for the same samples (no rearrangements=white. The CAAI scale is indicated below the figure). B) Structural sequence alterations identified by genome wide paired-end sequencing for selected samples from the various WAAI/CAAI groups. The outer circle shows the cytobands for each chromosome, followed by the copy number variation. The green bars in the center indicate smaller intra chromosomal changes while pink lines indicate inter chromosomal translocations. The lines indicate the position of the selected samples in the aCGH/CAAI groups. C) Correlation to each of the five intrinsic subtypes for a total of 186 cases sorted into WAAI/CAAI groups.
Figure 5
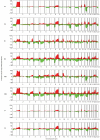
Figure 5. Frequencies of gain and loss of the eight WAAI/CAAI defined groups
The figure shows frequency plots illustrating the percentage of samples with gains and losses within each WAAI/CAAI group (red; gain, green; loss). A1 tumors are dominated by gain on 1q and 16p and loss on 16q. These alterations are frequent in A2 tumors, in addition to gain on 8q, 17q and 20q and loss on 6q, 8p, 11q, 13 and 17p. B1, B2, AB1 and AB2 tumors have similarities in the patterns of gain and loss with almost all chromosomes affected, a pattern very dissimilar from aberrations in A1 and A2 tumors. C1 tumors have few alterations, with gain of 8q dominating. This is the most frequent aberration in C2 tumors as well, followed by gain on 1q, 17q and 20q.
Figure 6
Figure 6. Pair wise comparison of WAAI and CAAI for the four groups across all chromosome arms
A-C) A pair wise correlation of high level CAAI (A), WAAI≥0.8 (B) and WAAI≤−0.8 (C) between all eight WAAI/CAAI groups for all chromosome arms. Green color indicate a correlation in favor of the first group in the pair, red color indicate a correlation in favor of the second group in the pair. Bright color indicate arms where the correlation reach a significant level (p<0.05), the dark color indicate arms where the correlation reach a significant level after Bonferroni correction (p<0.05/39).
Figure 7
Figure 7. CAAI and aCGH groups and breast cancer specific survival in the merged clinical dataset (n=451 cases)
A-D) The Kaplan Meier plots illustrate that breast cancer patients with tumors with B and AB tumors have the shortest survival (A), as do patients with high level CAAI (B). The differences between the groups by combination of WAAI groups and high level CAAI is shown in C. The Kaplan Meier curves show that B2 and AB2 have the worst survival, both in the merged cohort but also in patients that did not receive any adjuvant treatment (D). In C and D, groups with similar outcome and biology are collapsed. Kaplan Meier plots of survival estimates of all eight groups are shown in fig. S8. E-H) the different impact of histological grade in the four WAAI groups is illustrated. Patients with an A or C tumor were stratified into long, intermediate and short time survival by histological grade (p=0.02 and p=0.03) in contrast to patients with B and AB tumors where we could not show any difference in breast cancer specific survival related to histological grade.

Comment in

  • Genomics: A broad brush.
    McCarthy N. McCarthy N. Nat Rev Cancer. 2010 Sep;10(9):600. doi: 10.1038/nrc2920. Nat Rev Cancer. 2010. PMID: 20803811 No abstract available.

Similar articles

Cited by

References

    1. Early Breast Cancer Trialists’ Collaborative Group (EBCTCG) Effects of chemotherapy and hormonal therapy for early breast cancer on recurrence and 15-year survival: an overview of the randomised trials. Lancet. 2005;365:1687–1717. - PubMed
    1. Perou CM, Sorlie T, Eisen MB, van de RM, Jeffrey SS, Rees CA, Pollack JR, Ross DT, Johnsen H, Akslen LA, Fluge O, Pergamenschikov A, Williams C, Zhu SX, Lonning PE, Borresen-Dale AL, Brown PO, Botstein D. Molecular portraits of human breast tumours. Nature. 2000;406:747–752. - PubMed
    1. Sorlie T, Perou CM, Tibshirani R, Aas T, Geisler S, Johnsen H, Hastie T, Eisen MB, van de RM, Jeffrey SS, Thorsen T, Quist H, Matese JC, Brown PO, Botstein D, Eystein LP, Borresen-Dale AL. Gene expression patterns of breast carcinomas distinguish tumor subclasses with clinical implications. Proc. Natl. Acad. Sci. U. S. A. 2001;98:10869–10874. - PMC - PubMed
    1. Sorlie T, Tibshirani R, Parker J, Hastie T, Marron JS, Nobel A, Deng S, Johnsen H, Pesich R, Geisler S, Demeter J, Perou CM, Lonning PE, Brown PO, Borresen-Dale AL, Botstein D. Repeated observation of breast tumor subtypes in independent gene expression data sets. Proc. Natl. Acad. Sci. U. S. A. 2003;100:8418–8423. - PMC - PubMed
    1. Carey LA, Perou CM, Livasy CA, Dressler LG, Cowan D, Conway K, Karaca G, Troester MA, Tse CK, Edmiston S, Deming SL, Geradts J, Cheang MC, Nielsen TO, Moorman PG, Earp HS, Millikan RC. Race, breast cancer subtypes, and survival in the Carolina Breast Cancer Study. JAMA. 2006;295:2492–2502. - PubMed

Publication types