. 2010 Aug;120(8):2931-41.
doi: 10.1172/JCI41985. Epub 2010 Jul 1.

Disruption of hypothalamic leptin signaling in mice leads to early-onset obesity, but physiological adaptations in mature animals stabilize adiposity levels

Affiliations

Disruption of hypothalamic leptin signaling in mice leads to early-onset obesity, but physiological adaptations in mature animals stabilize adiposity levels

Laurence E Ring et al. J Clin Invest. 2010 Aug.

Abstract

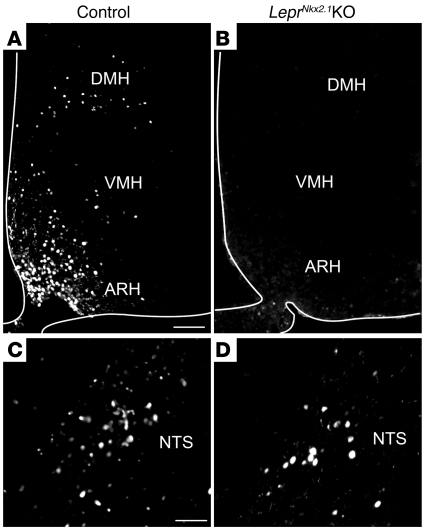
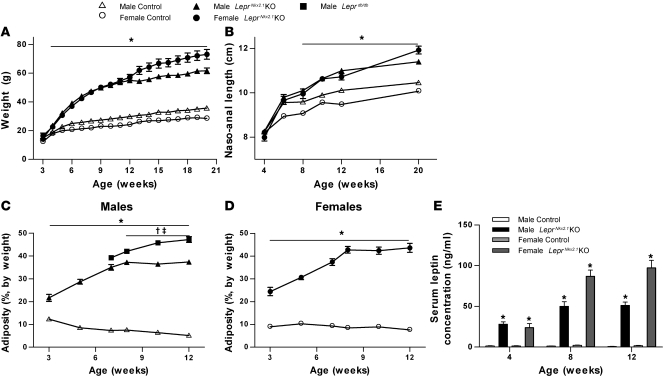
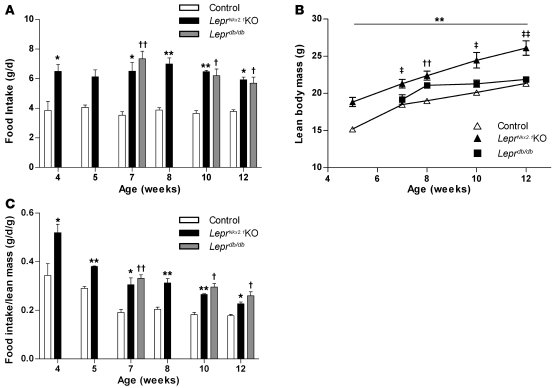
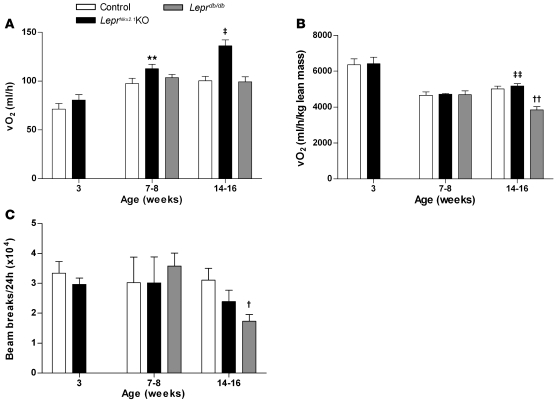
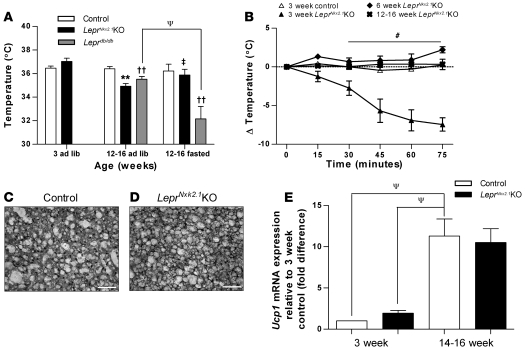
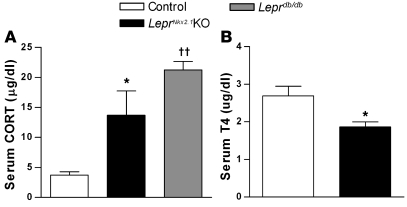
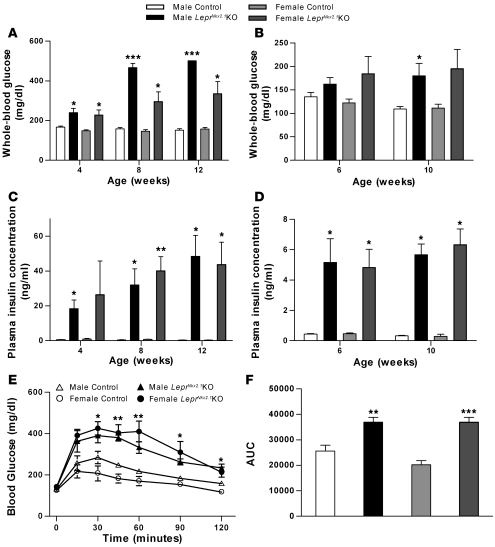
Distinct populations of leptin-sensing neurons in the hypothalamus, midbrain, and brainstem contribute to the regulation of energy homeostasis. To assess the requirement for leptin signaling in the hypothalamus, we crossed mice with a floxed leptin receptor allele (Leprfl) to mice transgenic for Nkx2.1-Cre, which drives Cre expression in the hypothalamus and not in more caudal brain regions, generating LeprNkx2.1KO mice. From weaning, LeprNkx2.1KO mice exhibited phenotypes similar to those observed in mice with global loss of leptin signaling (Leprdb/db mice), including increased weight gain and adiposity, hyperphagia, cold intolerance, and insulin resistance. However, after 8 weeks of age, LeprNkx2.1KO mice maintained stable adiposity levels, whereas the body fat percentage of Leprdb/db animals continued to escalate. The divergence in the adiposity phenotypes of Leprdb/db and LeprNkx2.1KO mice with age was concomitant with increased rates of linear growth and energy expenditure in LeprNkx2.1KO mice. These data suggest that remaining leptin signals in LeprNkx2.1KO mice mediate physiological adaptations that prevent the escalation of the adiposity phenotype in adult mice. The persistence of severe adiposity in LeprNkx2.1KO mice, however, suggests that compensatory actions of circuits regulating growth and energy expenditure are not sufficient to reverse obesity established at an early age.


Figures

Figure 1
Figure 1. The Nkx2.1-Cre driver is expressed broadly in the hypothalamus, but not in the midbrain or brainstem.
X-gal staining in sagittal (A) and coronal (BE) sections of Nkx2.1-Cre;ROSA26LacZ mice. (A) Sagittal section approximately 200 μm from midline. Labeled lines correspond to approximate locations of coronal sections in BE: medial preoptic area (B), suprachiasmatic nucleus and paraventricular nucleus (C), ARH (D), and ventral premammillary nucleus (E). Scale bars: 2 mm (A); 500 μm (BE).
Figure 2
Figure 2. Disruption of leptin signaling is localized to the hypothalamus in LeprNkx2.1KO mice.
(AD) Immunohistochemical detection of p-STAT3 following overnight fast and subsequent treatment with leptin. p-STAT3 staining was detected in the ARH, VMH, and DMH (A) and the NTS (C) of control animals. p-STAT3 staining was not observed in the ARH, VMH, or DMH (B), but was seen in the NTS (D), of LeprNkx2.1KO animals. White outlines in A and B denote tissue edges. Scale bars: 100 μm (A and B); 50 μm (C and D).
Figure 3
Figure 3. Growth rate and fat deposition are increased in young LeprNkx2.1KO mice.
(A) Weights of male and female LeprNkx2.1KO and control mice; n ≥ 10 for all groups at all points. (B) Naso-anal length over time of male and female LeprNkx2.1KO and control mice; n ≥ 5 for all groups at all points. (C) Adiposity, as measured by NMR, of male LeprNkx2.1KO, control, and Leprdb/db mice over time; n ≥ 4 for all groups at all points. (D) Adiposity, as measured by NMR, of female LeprNkx2.1KO and control mice over time; n ≥ 5 for all groups at all points. (E) Plasma leptin, as measured by ELISA, at 4, 8, and 12 weeks of male and female LeprNkx2.1KO and control mice; n ≥ 5 for all groups at all points. (AE) Results are mean ± SEM. *P < 0.01, LeprNkx2.1KO versus control; P < 0.01, Leprdb/db versus control; P < 0.01, Leprdb/db versus LeprNkx2.1KO. P values were calculated between age- and sex-matched groups.
Figure 4
Figure 4. Hyperphagia in LeprNkx2.1KO mice.
(A) Daily food intake of male control, LeprNkx2.1KO, and Leprdb/db mice at several ages; n ≥ 3 for all groups at all points. (B) Absolute lean body mass of male control, LeprNkx2.1KO, and Leprdb/db mice over time; n ≥ 4 for all groups at all points. (C) Daily food intake of male control, LeprNkx2.1KO, and Leprdb/db mice normalized to lean body mass at several ages; n ≥ 3 for all groups at all points. (AC) Results are mean ± SEM. *P < 0.05, **P < 0.01, LeprNkx2.1KO versus control; P < 0.05, ††P < 0.01, Leprdb/db versus control; P < 0.05, ‡‡P < 0.01, Leprdb/db versus LeprNkx2.1KO. P values were calculated between age-matched groups.
Figure 5
Figure 5. Increased energy expenditure in LeprNkx2.1KO vs Leprdb/db mice.
(A) Daily absolute oxygen consumption (VO2) of male control, LeprNkx2.1KO, and Leprdb/db mice at 3 different ages. (B) Daily oxygen consumption normalized to lean body mass of male control, LeprNkx2.1KO, and Leprdb/db mice at 3 different ages. (C) Locomotor activity, as measured by daily beam breaks, in male control, LeprNkx2.1KO, and Leprdb/db mice at 3 different ages. (AC) n ≥ 3 for all groups at all points. Results are mean ± SEM. **P < 0.01, LeprNkx2.1KO versus control; P < 0.05, ††P < 0.01, Leprdb/db versus control; P < 0.05, ‡‡P < 0.01, Leprdb/db versus LeprNkx2.1KO. P values were calculated between age-matched groups.
Figure 6
Figure 6. Dysregulation of acute thermogenesis in young LeprNkx2.1KO mice.
(A) Baseline core body temperatures in ad libitum–fed or fasting male control, LeprNkx2.1KO, and Leprdb/db mice at young and adult time points. (B) Response to acute cold challenge in LeprNkx2.1KO mice at 3, 6, and 12–16- weeks of age and in 3-week-old control mice. (C and D) H&E stain of BAT from 3-week-old control (C) and 3-week-old LeprNkx2.1KO (D) mice. Scale bars: 50 μm. (E) Quantitative PCR analysis of Ucp1 in BAT in control and LeprNkx2.1KO mice at 2 time points. (A, B, and E) n ≥ 4 for all groups at all points. Results are mean ± SEM. **P < 0.01, LeprNkx2.1KO versus control; ††P < 0.01, Leprdb/db versus control; P < 0.05, Leprdb/db versus LeprNkx2.1KO; #P < 0.05, 3-week-old LeprNkx2.1KO versus all other groups; ΨP < 0.05 as indicated by brackets.
Figure 7
Figure 7. Activation of the adrenal and thyroid access differs in LeprNkx2.1KO versus control mice.
(A) Morning CORT levels in male control, LeprNkx2.1KO, and Leprdb/db mice at 8 weeks; n > 3 for all groups. (B) Serum T4 levels in male control and LeprNkx2.1KO mice at 13–15 weeks; n = 8 for all groups. (A and B) Results are mean ± SEM. *P < 0.05, LeprNkx2.1KO versus control; ††P < 0.01, Leprdb/db versus control.
Figure 8
Figure 8. Impaired glucose homeostasis in LeprNkx2.1KO mice.
(A) Random-fed whole-blood glucose of LeprNkx2.1KO and control mice at several time points. (B) Fasted whole-blood glucose of LeprNkx2.1KO and control mice at 6 and 10 weeks. (C) Random-fed plasma insulin, as measured by ELISA, of LeprNkx2.1KO and control mice at 4, 8, and 12 weeks. (D) Fasted plasma insulin, as measured by ELISA, of LeprNkx2.1KO and control mice at 6 and 10 weeks. (E) GTT of LeprNkx2.1KO and control mice at 5 weeks of age. 2 mg/kg dextrose was injected i.p. at time 0. (F) Area under the curve calculation of GTT at 5 weeks of age. (AF) n ≥ 5 for all groups at all points. Results are mean ± SEM. *P < 0.05; **P < 0.01; ***P < 0.001. P values were calculated between age- and sex-matched groups.

Similar articles

Cited by

References

    1. Flegal KM, Carroll MD, Ogden CL, Curtin LR. Prevalence and trends in obesity among US adults, 1999–2008. JAMA. 2010;303(3):235–241. doi: 10.1001/jama.2009.2014. - DOI - PubMed
    1. Popkin BM. Recent dynamics suggest selected countries catching up to US obesity. Am J Clin Nutr. 2010;91(1):284S–288S. doi: 10.3945/ajcn.2009.28473C. - DOI - PMC - PubMed
    1. Zhang Y, Proenca R, Maffei M, Barone M, Leopold L, Friedman JM. Positional cloning of the mouse obese gene and its human homologue. Nature. 1994;372(6505): 425–432. doi: 10.1038/372425a0. - DOI - PubMed
    1. Maffei M, et al. Leptin levels in human and rodent: measurement of plasma leptin and ob RNA in obese and weight–reduced subjects. Nat Med. 1995;1(11):1155–1161. doi: 10.1038/nm1195-1155. - DOI - PubMed
    1. Tartaglia LA, et al. Identification and expression cloning of a leptin receptor, OB–R. Cell. 1995;83(7):1263–1271. doi: 10.1016/0092-8674(95)90151-5. - DOI - PubMed

Publication types

MeSH terms