

Time of flight mass spectrometry imaging of samples fractured in situ with a spring-loaded trap system
- PMID: 20593800
- PMCID: PMC2922971
- DOI: 10.1021/ac101243b
Time of flight mass spectrometry imaging of samples fractured in situ with a spring-loaded trap system
Abstract
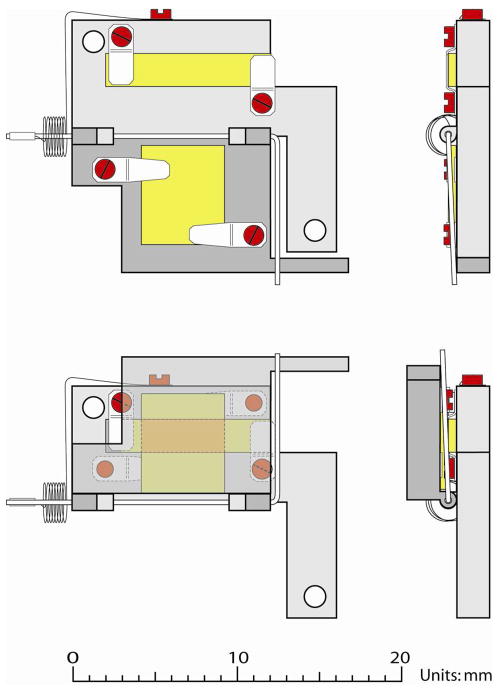
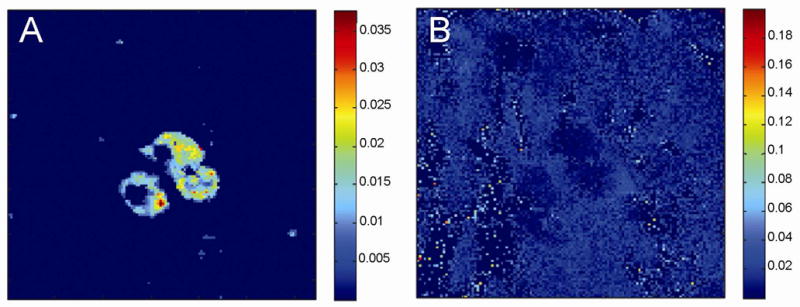
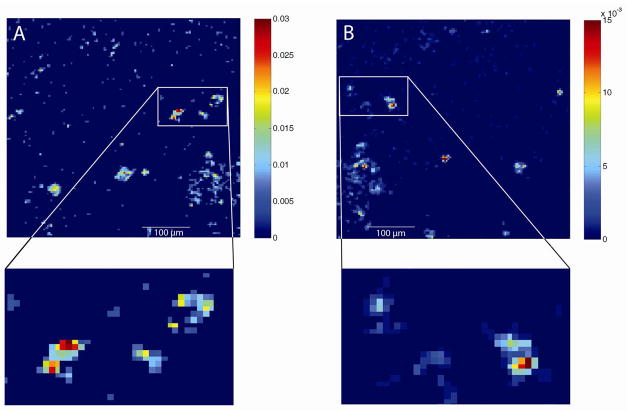
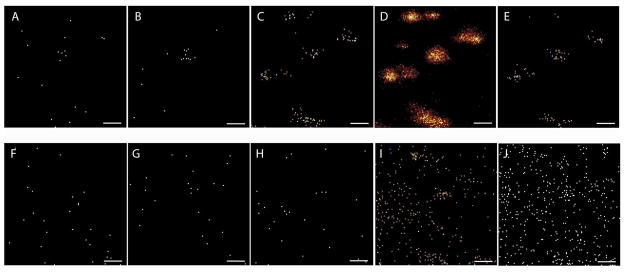
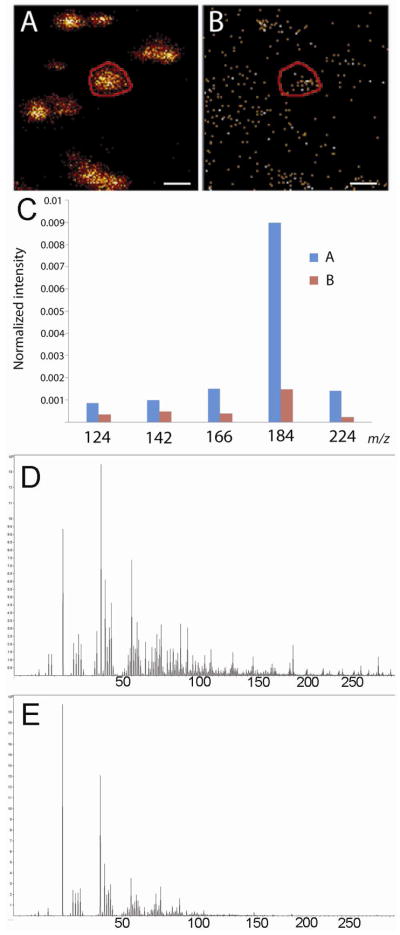
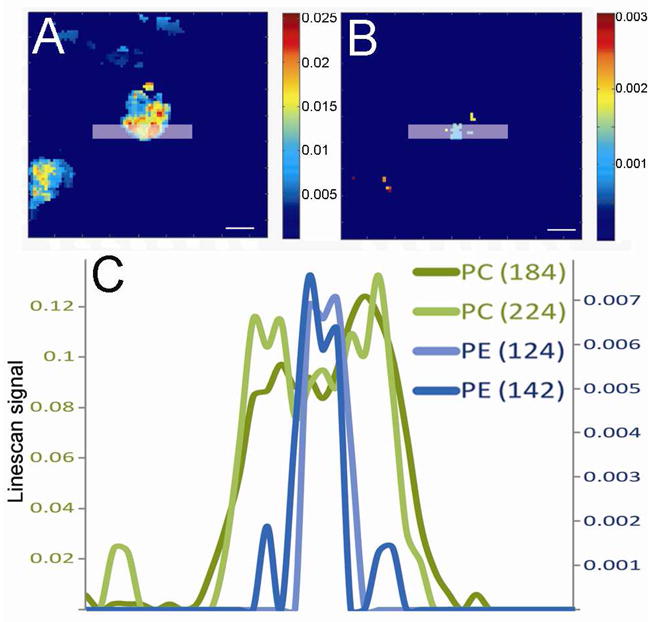
An in situ freeze fracture device featuring a spring-loaded trap system has been designed and characterized for time of flight secondary ion mass spectrometry (TOF SIMS) analysis of single cells. The device employs the sandwich assembly, which is typically used in freeze fracture TOF SIMS experiments to prepare frozen, hydrated cells for high-resolution SIMS imaging. The addition of the spring-loaded trap system to the sandwich assembly offers two advances to this sample preparation method. First, mechanizing the fracture by adding a spring standardizes each fracture by removing the need to manually remove the top of the sandwich assembly with a cryogenically cooled knife. A second advance is brought about because the top of the sandwich is not discarded after the sandwich assembly has been fractured. This results in two imaging surfaces effectively doubling the sample size and providing the unique ability to image both sections of a cell bifurcated by the fracture. Here, we report TOF SIMS analysis of freeze fractured rat pheochromocytoma (PC12) cells using a Bi cluster ion source. This work exhibits the ability to obtain single cell chemical images with subcellular lateral resolution from cells preserved in an ice matrix. In addition to preserving the cells, the signal from lipid fragment ions rarely identified in single cells are better observed in the freeze-fractured samples for these experiments. Furthermore, using the accepted argument that K(+) signal indicates a cell that has been fractured though the cytoplasm, we have also identified different fracture planes of cells over the surface. Coupling a mechanized freeze fracture device to high-resolution cluster SIMS imaging will provide the sensitivity and resolution as well as the number of trials required to carry out biologically relevant SIMS experiments.
Figures

Similar articles
-
Identification of cellular sections with imaging mass spectrometry following freeze fracture.Anal Chem. 2002 Aug 15;74(16):4020-6. doi: 10.1021/ac025574w. Anal Chem. 2002. PMID: 12199569
-
Proton transfer in time-of-flight secondary ion mass spectrometry studies of frozen-hydrated dipalmitoylphosphatidylcholine.Anal Chem. 2003 Aug 15;75(16):4087-94. doi: 10.1021/ac026353t. Anal Chem. 2003. PMID: 14632121
-
Atomic and molecular imaging at the single-cell level with TOF-SIMS.Anal Chem. 1997 Jul 1;69(13):2225-31. doi: 10.1021/ac9701748. Anal Chem. 1997. PMID: 9212701
-
Lipid imaging with time-of-flight secondary ion mass spectrometry (ToF-SIMS).Biochim Biophys Acta. 2011 Nov;1811(11):976-90. doi: 10.1016/j.bbalip.2011.05.007. Epub 2011 May 27. Biochim Biophys Acta. 2011. PMID: 21664291 Free PMC article. Review.
-
Biomedical studies by TOF-SIMS imaging.Biointerphases. 2014 Mar 11;10(1):018901. doi: 10.1116/1.4901511. Biointerphases. 2014. PMID: 25708628 Review.
Cited by
-
Imaging mass spectrometry in neuroscience.ACS Chem Neurosci. 2013 May 15;4(5):666-79. doi: 10.1021/cn400053c. Epub 2013 Apr 30. ACS Chem Neurosci. 2013. PMID: 23530951 Free PMC article. Review.
-
Characterization of sample preparation methods of NIH/3T3 fibroblasts for ToF-SIMS analysis.Biointerphases. 2013 Dec;8(1):15. doi: 10.1186/1559-4106-8-15. Epub 2013 Jul 5. Biointerphases. 2013. PMID: 24706128 Free PMC article.
-
Fluid Flow and Effusive Desorption: Dominant Mechanisms of Energy Dissipation after Energetic Cluster Bombardment of Molecular Solids.J Phys Chem Lett. 2011 Jul 22;2(16):2009-2014. doi: 10.1021/jz200708j. J Phys Chem Lett. 2011. PMID: 21860689 Free PMC article.
-
Identifying individual cell types in heterogeneous cultures using secondary ion mass spectrometry imaging with C60 etching and multivariate analysis.Anal Chem. 2012 Jan 17;84(2):893-900. doi: 10.1021/ac201179t. Epub 2012 Jan 3. Anal Chem. 2012. PMID: 22098081 Free PMC article.
-
Analysis of liposome model systems by time-of-flight secondary ion mass spectrometry.Surf Interface Anal. 2014 Nov;46(Suppl 1):74-78. doi: 10.1002/sia.5623. Surf Interface Anal. 2014. PMID: 25918450 Free PMC article.
References
-
- Monroe EB, Jurchen JC, Lee J, Rubakhin SS, Sweedler JV. J Am Chem Soc. 2005;127:12152–12153. - PubMed
-
- Sjovall P, Lausmaa J, Nygren H, Carlsson L, Malmberg P. Anal Chem. 2003;75:3429–3434. - PubMed
-
- Fletcher JS, Rabbani S, Henderson A, Blenkinsopp P, Thompson SP, Lockyer NP, Vickerman JC. Anal Chem. 2008;80:9058–9064. - PubMed
Publication types
MeSH terms
Substances
Grants and funding
LinkOut - more resources
Full Text Sources
