Review
. 2010:11:65-89.
doi: 10.1146/annurev-genom-082509-141523.

Admixture mapping comes of age

Affiliations
Review

Admixture mapping comes of age

Cheryl A Winkler et al. Annu Rev Genomics Hum Genet. 2010.

Abstract

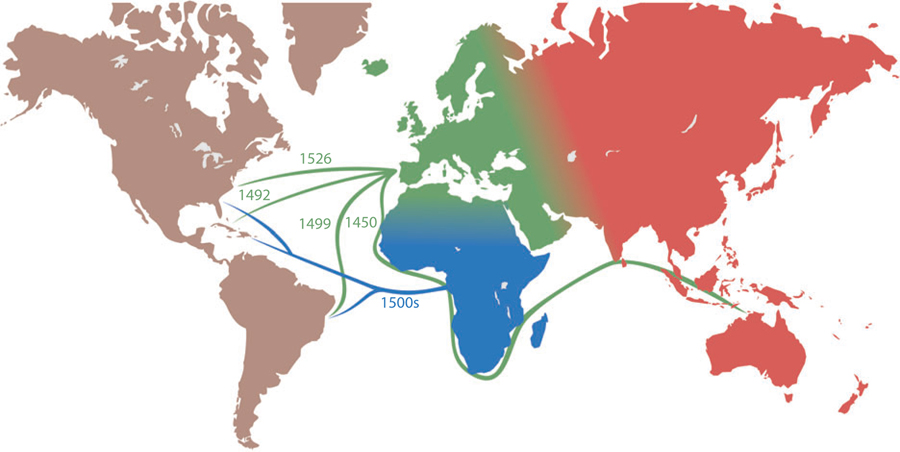
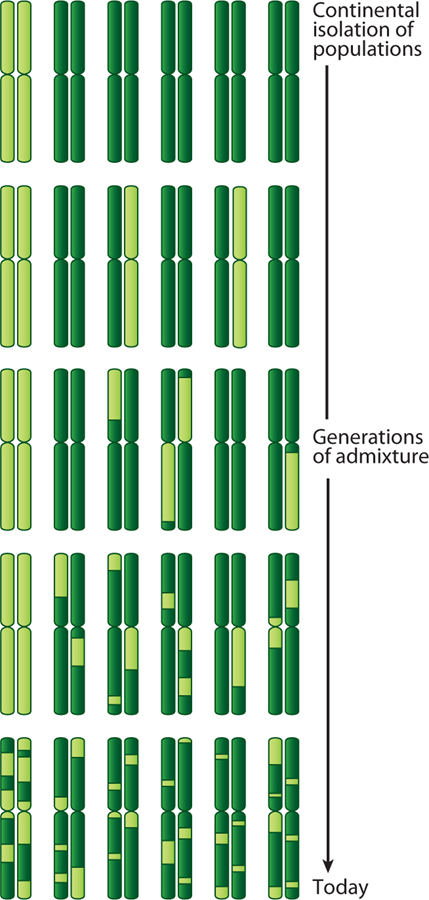
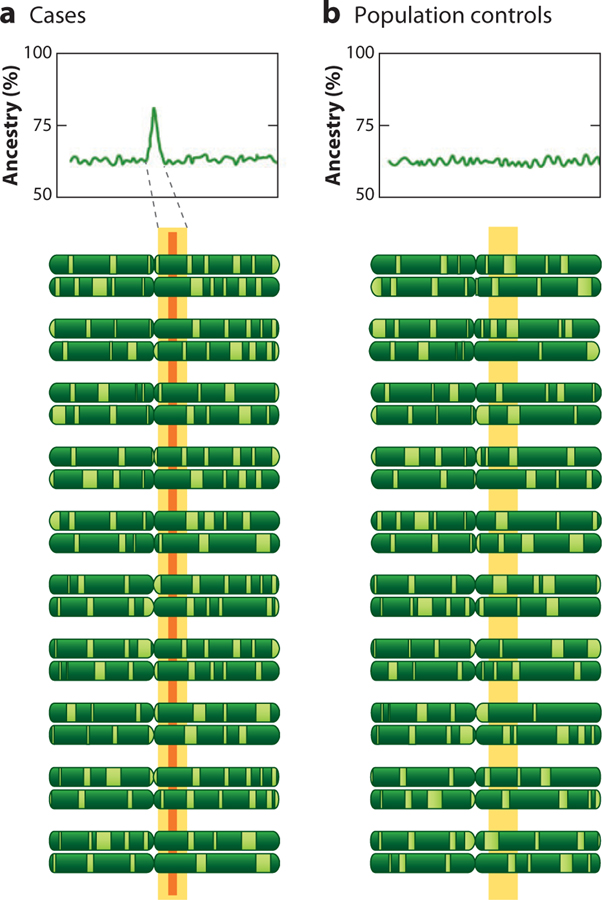
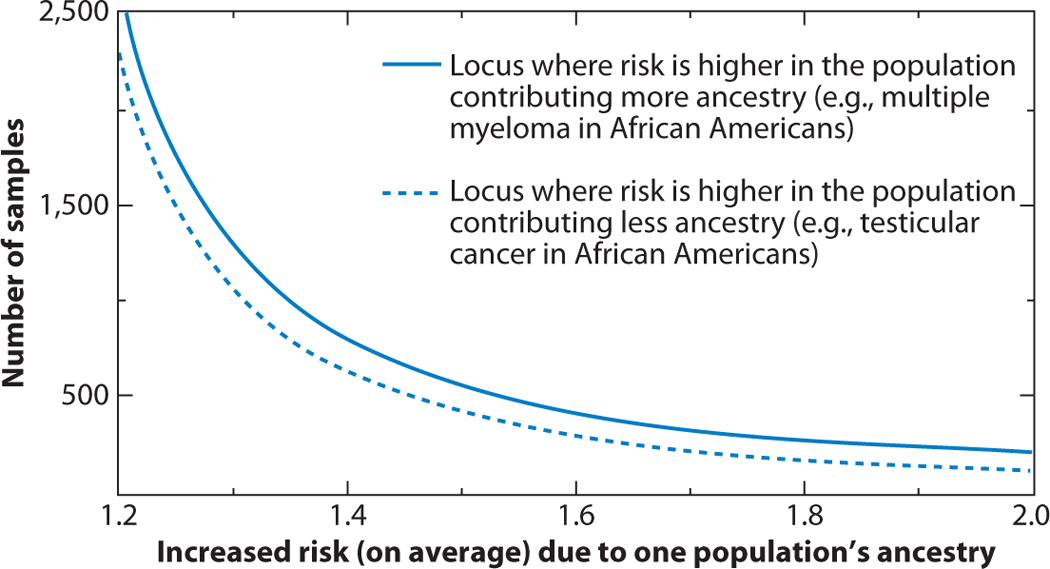
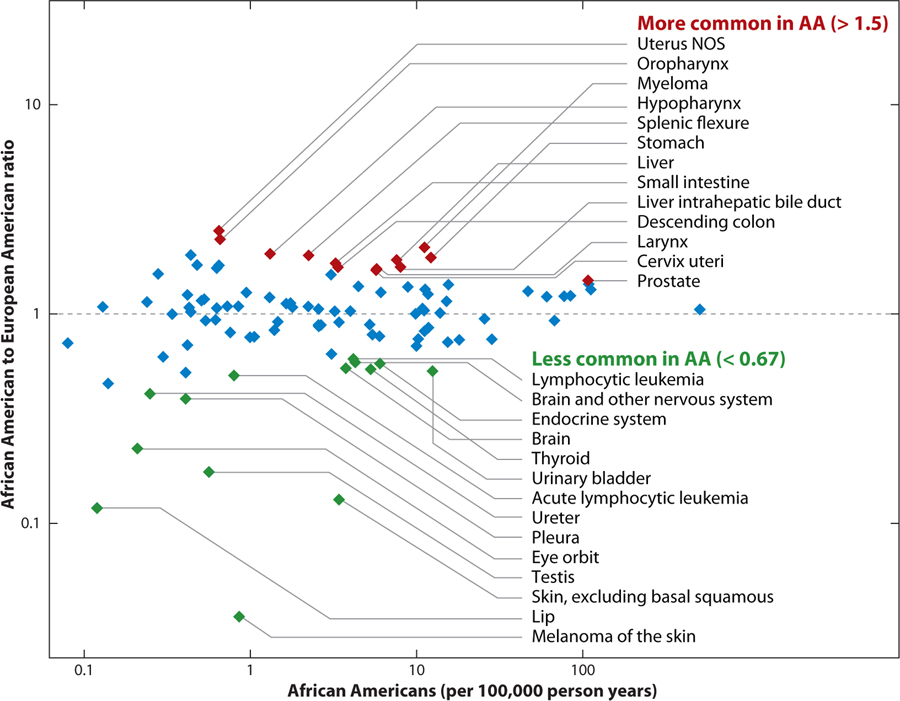
Admixture mapping is based on the hypothesis that differences in disease rates between populations are due in part to frequency differences in disease-causing genetic variants. In admixed populations, these genetic variants occur more often on chromosome segments inherited from the ancestral population with the higher disease variant frequency. A genome scan for disease association requires only enough markers to identify the ancestral chromosome segments; for recently admixed populations, such as African Americans, 1,500-2,500 ancestry-informative markers (AIMs) are sufficient. The method was proposed over 50 years ago, but the AIM panels and statistical methods required have only recently become available. Since the first admixture scan in 2005, the genetic bases for a range of diseases/traits have been identified by admixture mapping. Here, we provide a historical perspective, review AIM panels and software packages, and discuss recent successes and unexpected insights into human diseases that exhibit disparate rates across human populations.


Figures

Figure 1
Figure 1
Major migrations and diasporas, 1400–1800, that are sources of important admixed populations for admixture mapping.
Figure 2
Figure 2
Schematic pattern of chromosomal ancestry resulting from a moderate number (~8–20) of generations since a two-way admixture event. Starting with the second generation, recombination produces chromosomal blocks of different continental ancestries. The present day admixed population has a varying extent of overall ancestry and has blocks of ancestry that vary in size both because of the random nature of recombination and because the original chromosomes have been subject to recombination for different numbers of generations.
Figure 3
Figure 3
Schematic of the pattern of chromosomal admixture around a disease locus. We suppose the disease is inherited from the majority ancestry population (dark green), with the minority ancestry population shown in light green. The graphs show the percentage of ancestry derived from the dark green segment of chromosome. (a) In the region of the disease locus (yellow bar), there is an excess of majority ancestry blocks among cases, revealed as a spike in a graph of average ancestry for cases along the chromosome. The orange bar indicates the location of the disease gene. (b) Among population controls, the distribution of ancestry blocks is random across the chromosome. The spike of ancestry can be quantified either by comparing case ancestry with control ancestry at the same location or by comparing peak case ancestry with average case ancestry across all chromosomes.
Figure 4
Figure 4
Number of samples required to detect a disease or trait locus with perfect information on ancestry and the same proportions of two-way ancestry in each parent. The sample number needed to detect an association in African Americans is estimated by averaging the power for a given risk model and the percentage of ancestry over the percentages of ancestry seen in African Americans (European ancestry ~20 ± 12%). In practice, the power is robust for ancestry ranging from 10–90%. From Reference (49).
Figure 5
Figure 5
The extent of admixture linkage disequilibrium (ALD) around the Duffy Antigen Receptor for Chemokines (DARC or FY) gene. The alternative fixation of the FY allele in sub-Saharan Africa and the FY+ allele in European populations is an extreme example of differentiation between two continental populations; however, it does allow the tracking of ALD between the FY alleles and 17 neighboring markers. The x-axis shows the position of the neighboring markers relative to the DARC locus and the y-axis shows the strength of the associations with the DARC allele. The gray dotted line represents a corrected probability of 0.05. Adapted from Reference (35).
Figure 6
Figure 6
Example of the influence of underlying chromosomal ancestry on observed genotype. For simplicity, we suppose we are viewing a single chromosome (X chromosome or autosomal chromosome with known phase). Observation of the genotype at a locus allows a probabilistic inference of the ancestry of the locus; e.g., for locus n, the observed allele 1 is more likely to have come from an A chromosome than from a B chromosome (here, for simplicity, allele 1 is always the more frequent allele in ancestral population A). Where recombination has occurred since the admixture event, the chromosomal ancestry switches, so there is a succession of blocks of alternating ancestry. The observed alleles will probabilistically follow the allele frequencies from the underlying ancestral population of that chromosomal block. The task is to use knowledge of the ancestral allele frequencies, proportion of A and B ancestry, and amount of recombination (a function of the genetic distance between the loci and the time since admixture) to infer the succeeding blocks of A and B ancestry from observation of the genotypes.
Figure 7
Figure 7
Ideal output from a chromosomal ancestry inference program: ancestry for an autosomal chromosome pair from an individual (a) and from a second individual (b). For each point along the chromosome, the program indicates whether 0, 1, or 2 chromosomes carry the specified ancestry (light green). Realistically, programs indicate the probability of carrying 0, 1, or 2 chromosomes from the specified ancestry; in favorable cases, the program predicts the ancestry with near certainty.
Figure 8
Figure 8
Results of the admixture mapping genome scan for combined kidney diseases focal segmental glomerulosclerosis (FSGS) and HIV-associated nephropathy (HIVAN), which are, respectively, fourfold and 60-fold more frequent in African Americans than in European Americans. The sharp peak of African ancestry among cases occurs in the region of MYH9 on chromosome 22. The inset shows the close up of the peak, and the localization of the association to a 95% credible interval of ~3 Mb. Also shown are genome-wide and peak (LOD) scores for several calculations; genome-wide LOD scores greater than 2 are considered significant. Adapted from Reference (34).
Figure 9
Figure 9
Relative frequencies of cancers in African Americans and European Americans. Cancers with significant differences in frequency (red or green) are potential targets for admixture mapping. Data were extracted using SEER software using U.S. cancer incidence from 2000–2005, age adjusted using 2000 census results as the standard. Incidence rates were calculated separately for European (EA) and American Americans (AA) for the number of cases per 100,000 person years.

Similar articles

Cited by

References

    1. Althuis MD, Brogan DD, Coates RJ, Daling JR, Gammon MD, et al. 2003. Breast cancers among very young premenopausal women (United States). Cancer Causes Control 14:151–60 - PubMed
    1. Altshuler D, Brooks LD, Chakravarti A, Collins FS, Daly MJ, Donnelly P. 2005. A haplotype map of the human genome. Nature 437:1299–320 - PMC - PubMed
    1. Amundadottir LT, Sulem P, Gudmundsson J, Helgason A, Baker A, et al. 2006. A common variant associated with prostate cancer in European and African populations. Nat. Genet. 38:652–8 - PubMed
    1. Anderson WF, Rosenberg PS, Menashe I, Mitani A, Pfeiffer RM. 2008. Age-related crossover in breast cancer incidence rates between black and white ethnic groups. J. Natl. Cancer Inst. 100:1804–14 - PMC - PubMed
    1. Basu A, Tang H, Arnett D, Gu CC, Mosley T, et al. 2009. Admixture mapping of quantitative trait loci for BMI in African Americans: evidence for loci on chromosomes 3q, 5q, and 15q. Obesity (Silver Spring) 17:1226–31 - PMC - PubMed

Publication types

LinkOut - more resources