

Ultrasonographic detection and assessment of the severity of Crohn's disease recurrence after ileal resection
- PMID: 20594291
- PMCID: PMC2914775
- DOI: 10.1186/1471-230X-10-69
Ultrasonographic detection and assessment of the severity of Crohn's disease recurrence after ileal resection
Abstract
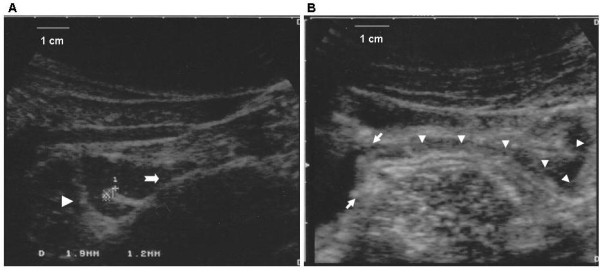
Background: Recurrence and severity of Crohn's disease mucosal lesions after "curative" ileal resection is assessed at endoscopy. Intramural lesions can be detected as increased wall thickness at Small Intestine Contrast Ultrasonography (SICUS).
Aims: To assess after ileal resection whether: 1) SICUS detects recurrence of Crohn's disease lesions, 2) the intestinal wall thickness measured at the level of ileo-colonic anastomosis predicts the severity of endoscopic lesions, 3) the extension of intramural lesions of the neo-terminal ileum is useful for grading severity of the recurrence, 4) the combined measures of wall thickness of the ileo-colonic anastomosis and of the extension of intramural lesions at level of the neo-terminal ileum may predict the endoscopic Rutgeerts score
Methods: Fifty eight Crohn's disease patients (M 37, age range 19-75 yrs) were prospectively submitted at 6-12 months intervals after surgery to endoscopy and SICUS for a total of 111 observations.
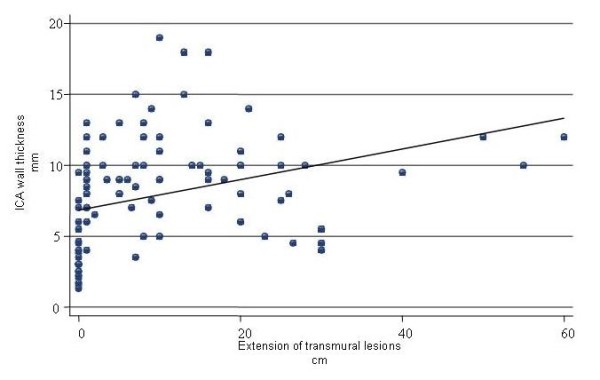
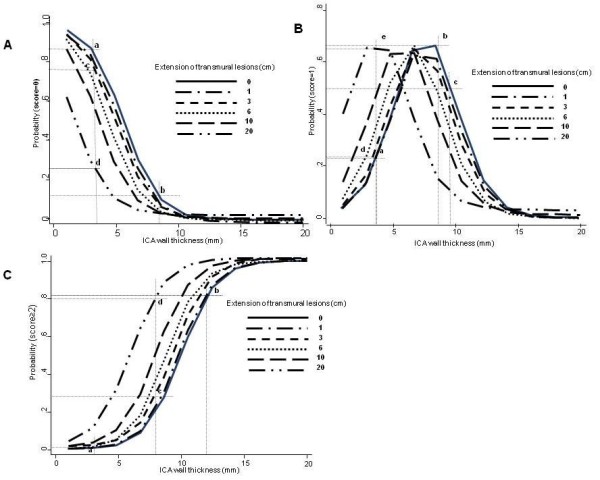
Results: Six months or more after surgery wall thickness of ileo-colonic anastomosis > 3.5 mm identified 100% of patients with endoscopic lesions (p < 0.0001). ROC curve analysis, combining wall thickness of ileo-colonic anastomosis and the extension of intramural lesions of neo-terminal ileum, discriminated (0.95) patients with, from those without, endoscopic lesions. Performing two multiple logistic regression analyses only wall thickness of ileo-colonic anastomosis and extension of neo-terminal ileum intramural lesions were significantly associated with absence or presence of endoscopic lesions. An ordinal polychotomus logistic model, considering all investigated variables, confirmed that only SICUS variables were associated with endoscopic grading of severity.
Conclusions: In patients submitted to ileal resection for Crohn's disease non-invasive Small Intestine Contrast Ultrasonography 1) by assessing thickness of ileo-colonic anastomosis accurately detects initial, minimal Crohn's disease recurrence, and 2) by assessing both thickness of ileo-colonic anastomosis and extension of intramural lesions of neo-terminal ileum grades the severity of the post-surgical recurrence.
Figures


Similar articles
-
Severity of postoperative recurrence in Crohn's disease: correlation between endoscopic and sonographic findings.Inflamm Bowel Dis. 2009 Nov;15(11):1635-42. doi: 10.1002/ibd.20948. Inflamm Bowel Dis. 2009. PMID: 19408327 Clinical Trial.
-
Small intestine contrast ultrasonography vs computed tomography enteroclysis for assessing ileal Crohn's disease.World J Gastroenterol. 2012 Nov 14;18(42):6088-95. doi: 10.3748/wjg.v18.i42.6088. World J Gastroenterol. 2012. PMID: 23155337 Free PMC article.
-
Role of bowel ultrasound as a predictor of surgical recurrence of Crohn's disease.Scand J Gastroenterol. 2013 May;48(5):552-5. doi: 10.3109/00365521.2013.777774. Epub 2013 Mar 11. Scand J Gastroenterol. 2013. PMID: 23477675
-
Endoscopic Assessment of Postoperative Recurrence in Crohn's Disease: Evolving Concepts.Gastrointest Endosc Clin N Am. 2025 Jan;35(1):121-140. doi: 10.1016/j.giec.2024.04.010. Epub 2024 May 23. Gastrointest Endosc Clin N Am. 2025. PMID: 39510683 Review.
-
What's New in the Postoperative Management of Crohn's Disease?Dig Dis Sci. 2022 Aug;67(8):3508-3517. doi: 10.1007/s10620-021-07205-w. Epub 2021 Aug 18. Dig Dis Sci. 2022. PMID: 34406585 Free PMC article. Review.
Cited by
-
Intestinal ultrasound and management of small bowel Crohn's disease.Therap Adv Gastroenterol. 2018 May 1;11:1756284818771367. doi: 10.1177/1756284818771367. eCollection 2018. Therap Adv Gastroenterol. 2018. PMID: 29881463 Free PMC article. Review.
-
SICUS and CEUS imaging in Crohn's disease: an update.J Ultrasound. 2017 Jan 2;20(1):1-9. doi: 10.1007/s40477-016-0230-5. eCollection 2017 Mar. J Ultrasound. 2017. PMID: 28298939 Free PMC article. Review.
-
Advanced imaging techniques for small bowel Crohn's disease: what does the future hold?Therap Adv Gastroenterol. 2018 Feb 12;11:1756283X18757185. doi: 10.1177/1756283X18757185. eCollection 2018. Therap Adv Gastroenterol. 2018. PMID: 29467827 Free PMC article. Review.
-
Assessment of Crohn's disease activity by Doppler sonography.Saudi Med J. 2017 Apr;38(4):391-395. doi: 10.15537/smj.2017.4.17855. Saudi Med J. 2017. PMID: 28397945 Free PMC article.
-
A survey of current practices used to maintain surgically induced remission following intestinal resection for Crohn's disease.Int J Colorectal Dis. 2013 Aug;28(8):1073-9. doi: 10.1007/s00384-013-1668-y. Epub 2013 Mar 9. Int J Colorectal Dis. 2013. PMID: 23474826
References
-
- Rutgeerts P, Geboes K, Vantrappen G, Beyls J, Kerremans R, Hiele M. Predictability of the postoperative course of Crohn's disease. Gastroenterology. 1990;99:956–963. - PubMed
-
- Belsy J, Epstein O, Heresbach D. Systematic review: oral bowel preparation for colonoscopy. Aliment Pharmacol Ther. 2007;25:373–384. - PubMed
MeSH terms
LinkOut - more resources
Full Text Sources
Medical
