

Growth in children with cerebral palsy during five years after selective dorsal rhizotomy: a practice-based study
- PMID: 20594320
- PMCID: PMC2913912
- DOI: 10.1186/1471-2377-10-57
Growth in children with cerebral palsy during five years after selective dorsal rhizotomy: a practice-based study
Abstract
Background: Overweight is reported as a side effect of SDR. The aims were to study the development of weight, height and body mass index (BMI) during five years after SDR.
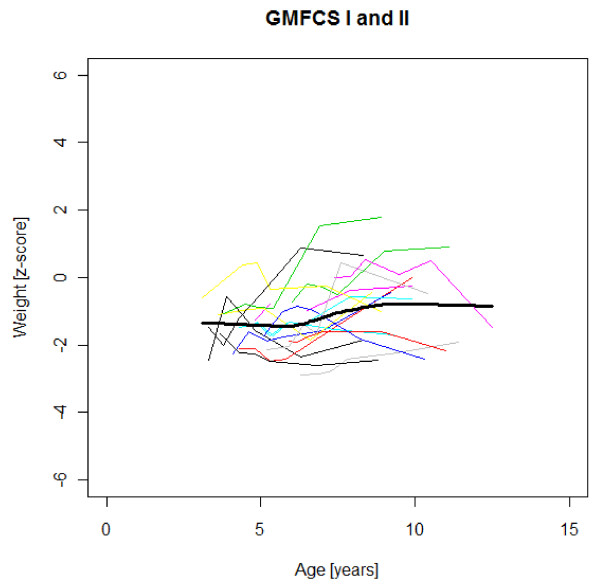
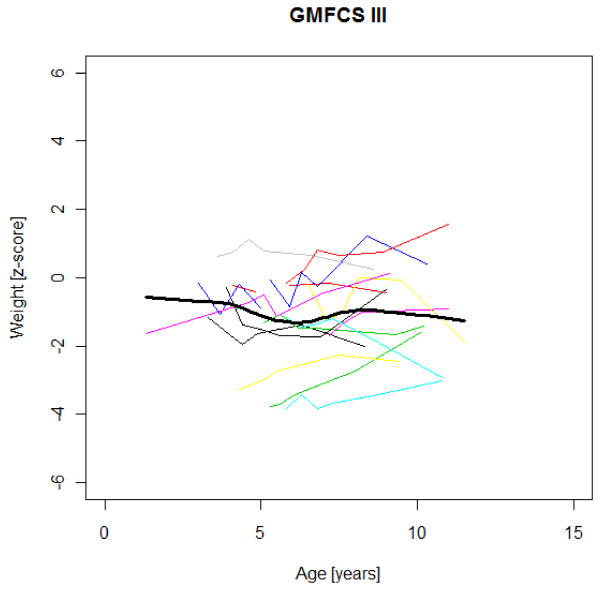
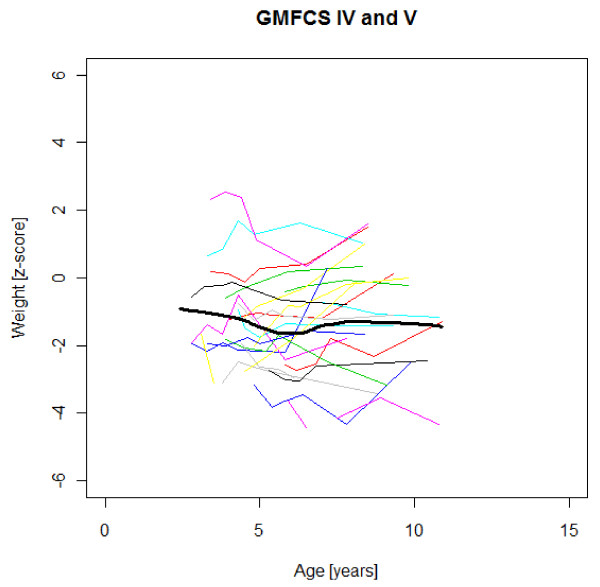
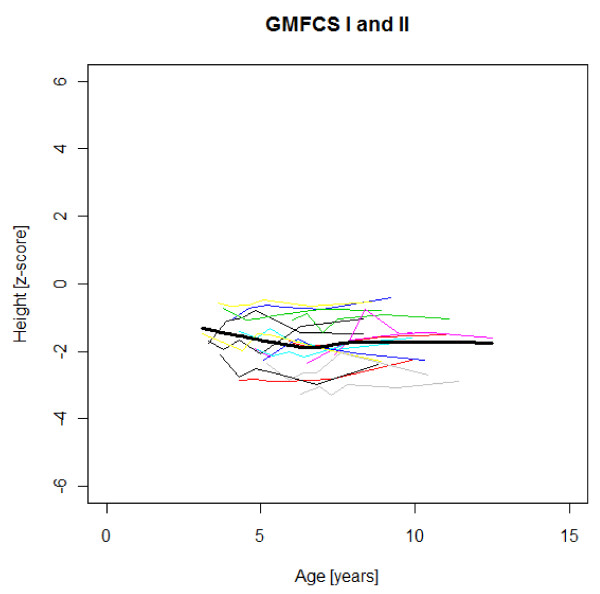
Methods: This prospective, longitudinal and practice-based study included all 56 children with CP spastic diplegia undergoing SDR from the start in March 1993 to April 2003 in our hospital. The preoperative Gross Motor Function Classification System (GMFCS) levels were I-II in 17, III in 15, IV-V in 24 children. Median age at SDR was 4.3 years (range 2.4-7.4 years). Weight and height/recumbent length were measured. Swedish growth charts for typically developing children generated weight, height and BMI z-scores for age and gender.
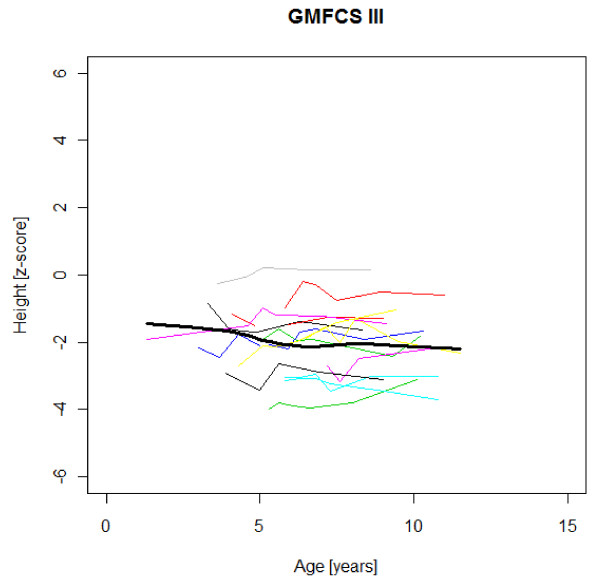
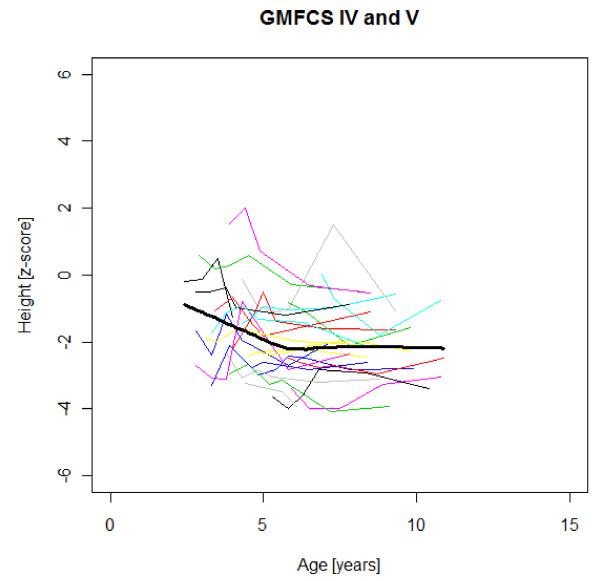
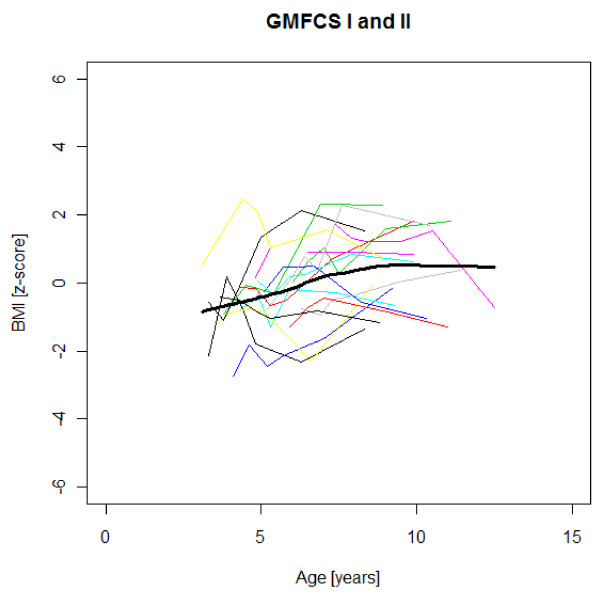
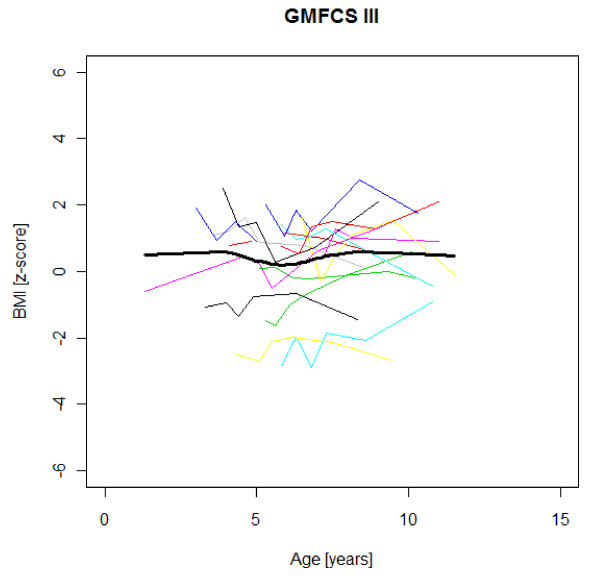
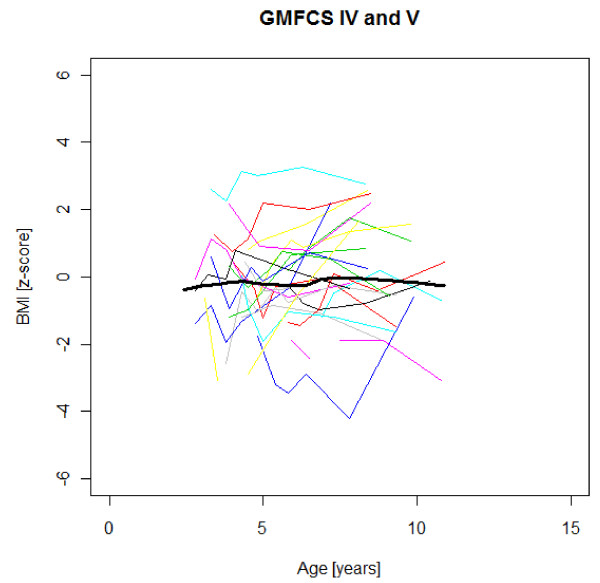
Results: The preoperative median z-scores were for height -1.92 and for body mass index (BMI) -0.22. Five years later, the median BMI z-score was increased by + 0.57 (p < 0.05). The occurrence of thinness (BMI < -2 SD) was decreased (n.s.) and obesity (BMI > + 2 SD) increased (p < 0.05). Baseline BMI and age at the start of follow-up influenced the BMI change during the five years (p < 0.001 and p < 0.05 respectively).The individual growth was highly variable, but a tendency towards increasing stunting with age was seen in severe gross motor dysfunction (GMFCS levels IV-V) and the opposite, a slight catch-up of height in children with walking ability (GMFCS levels I-III).
Conclusions: These are the first available subtype- and GMFCS-specific longitudinal growth data for children with CP spastic diplegia. Their growth potential according to these data should be regarded as a minimum, as some children were undernourished. It is unknown whether the spasticity reduction through SDR increased the weight gain velocity, or if the relative weight increase was part of the general "obesity epidemic".For some children the weight increase was highly desirable. In others, it resulted in overweight and obesity with risk of negative health effects. Weight and height should be monitored to enable early prevention of weight aberrations also causing problems with mobility, activity and participation.
Figures
References
-
- Stevenson RD, Hayes RP, Cater LV, Blackman JA. Clinical correlates of linear growth in children with cerebral palsy. DMCN. 1994;36:135–142. - PubMed
-
- Stevenson RD, Roberts CD, Vogtle L. The effects of non-nutritional factors on growth in cerebral palsy. DMCN. 1995;37:124–130. - PubMed
-
- Reilly S, Skuse D. Characteristics and management of feeding problems of young children with cerebral palsy. DMCN. 1992;34:379–88. - PubMed
-
- Sullivan PB, Juszcak E, Lambert BR, Rose M, Ford-Adams ME, Johnson A. Impact of feeding problems on nutritional intake and growth: Oxford feeding study II. DMCN. 2002;44:461–467. - PubMed
Publication types
MeSH terms
LinkOut - more resources
Full Text Sources
Medical
Miscellaneous
