. 2010 Sep;1800(9):906-11.
doi: 10.1016/j.bbagen.2010.05.002. Epub 2010 May 25.

Pharmacological profiles of the murine gastric and colonic H,K-ATPases

Affiliations

Pharmacological profiles of the murine gastric and colonic H,K-ATPases

Jiahong Shao et al. Biochim Biophys Acta. 2010 Sep.

Abstract

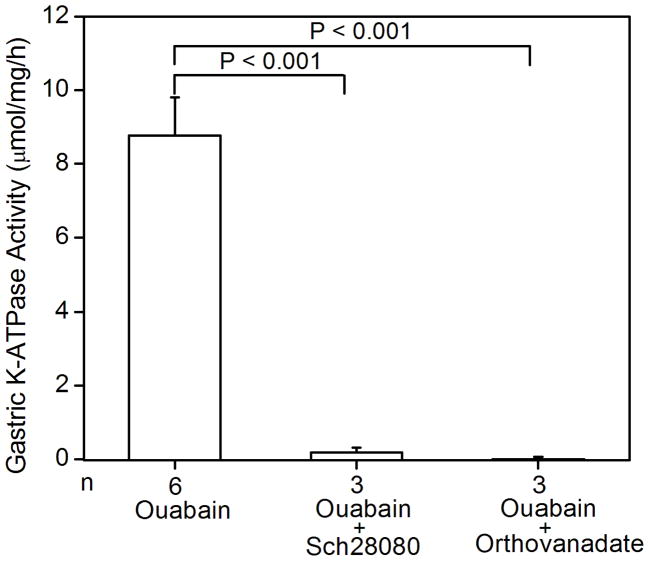
Background: The H,K-ATPase, consisting of α and ß subunits, belongs to the P-type ATPase family. There are two isoforms of the α subunit, HKα₁ and HKα₂ encoded by different genes. The ouabain-resistant gastric HKα₁-H,K-ATPase is Sch28080-sensitive. However, the colonic HKα₂-H,K-ATPase from different species shows poor primary structure conservation of the HKα₂ subunit between species and diverse pharmacological sensitivity to ouabain and Sch28080. This study sought to determine the contribution of each gene to functional activity and its pharmacological profile using mouse models with targeted disruption of HKα₁, HKα₂, or HKbeta genes.

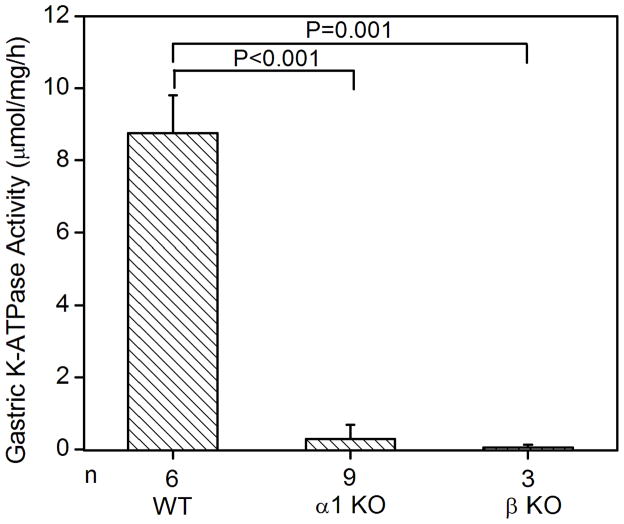
Methods: Membrane vesicles from gastric mucosa and distal colon in wild-type (WT), HKα₁, HKα₂, or HKß knockout (KO) mice were extracted. K-ATPase activity and pharmacological profiles were examined.

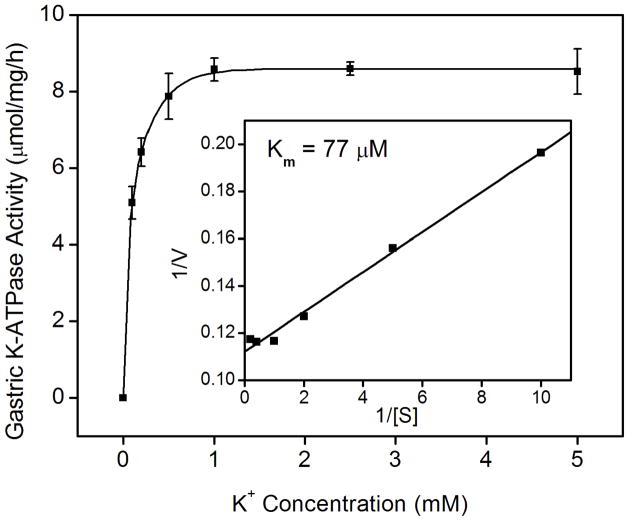
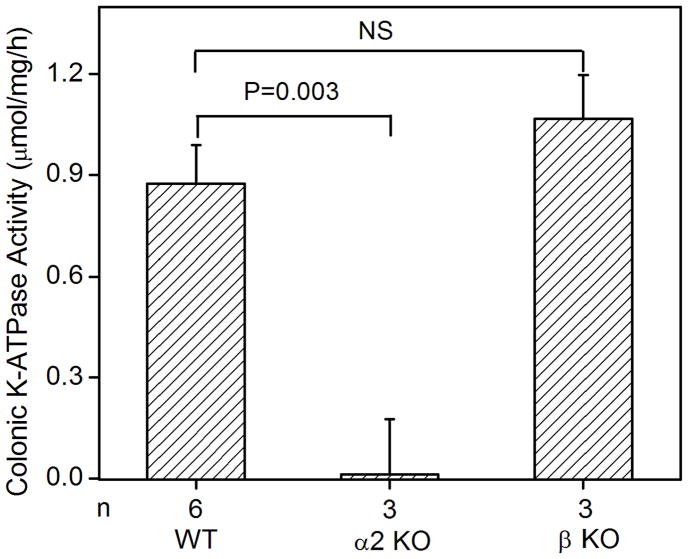
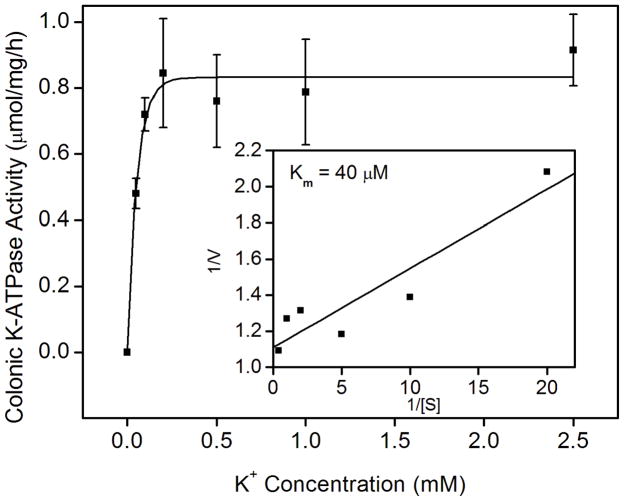
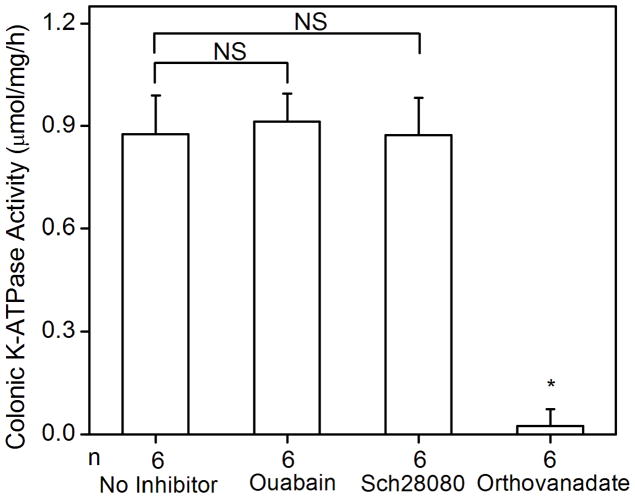
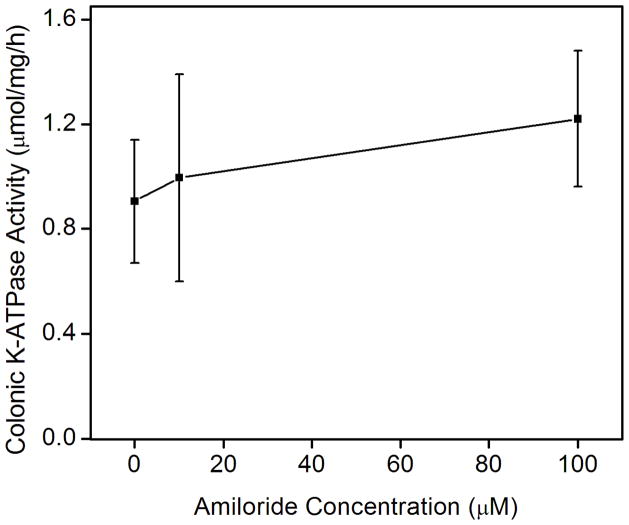
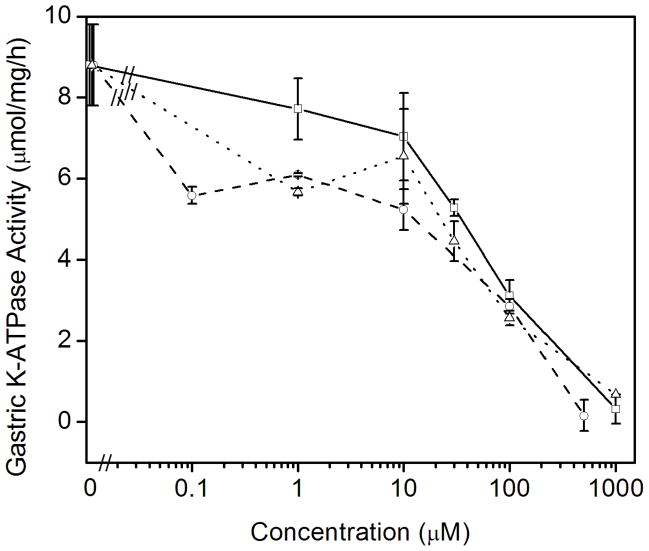
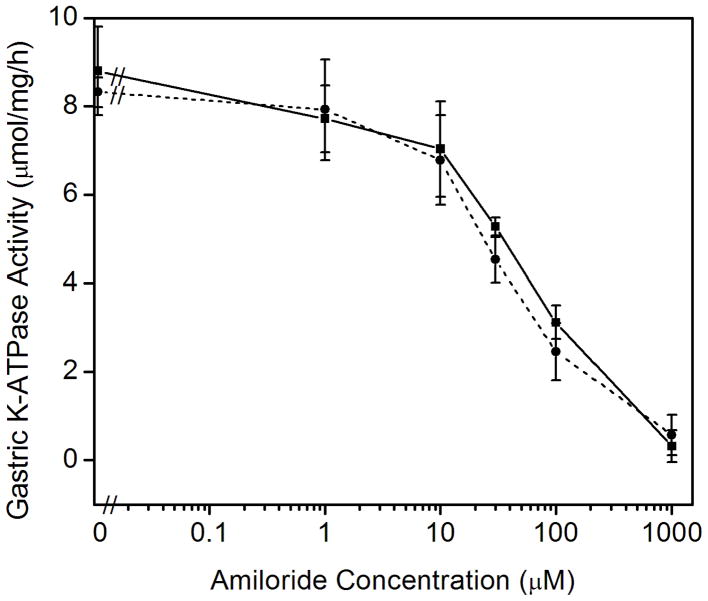
Results: The colonic H,K-ATPase demonstrated slightly greater affinity for K(+) than the gastric H,K-ATPase. This K-ATPase activity was not detected in the colon of HKα₂ KO but was observed in HKß KO with properties indistinguishable from WT. Neither ouabain nor Sch28080 had a significant effect on the WT colonic K-ATPase activity, but orthovanadate abolished this activity. Amiloride and its analogs benzamil and 5-N-ethyl-N-isopropylamiloride inhibited K-ATPase activity of HKα₁-containing H,K-ATPase; the dose dependence of inhibition was similar for all three inhibitors. In contrast, the colonic HKα₂-H,K-ATPase was not inhibited by these compounds.

Conclusions: These data demonstrate that the mouse colonic H,K-ATPase exhibits a ouabain- and Sch28080-insensitive, orthovanadate-sensitive K-ATPase activity. Interestingly, pharmacological studies suggested that the mouse gastric H,K-ATPase is sensitive to amiloride.

General significance: Characterization of the pharmacological profiles of the H,K-ATPases is important for understanding the relevant knockout animals and for considering the specificity of the inhibitors.


Figures

Figure 1
Figure 1
K-ATPase activity in the gastric membrane vesicles of mice (A) Gastric K-ATPase activity was determined in the gastric membrane vesicles of wild type (WT), HKα1 knockout (α1 KO), and HKβ knockout (β KO) mice in the presence of 1 mM ouabain. Values (in micromole ATP hydrolyzed per mg membrane protein per hour) are means ± se from the indicated number of animals (n). (B) K-dependent ATPase activity was measured in the gastric membrane vesicles extracted from HKα1 wild type mice. K-ATPase activity of mouse gastric mucosa was fully stimulated by 1.0 mM K+. Inset, double-reciprocal plot of 1/V versus 1/[S] indicates apparent Km of 77 μM for the gastric K-ATPase activity. (C) Gastric K-ATPase activity was measured in the presence of 1 mM ouabain or in the presence of ouabain plus 100 μM Sch28080, or ouabain plus 100 μM orthovanadate. Values are means ± se from the indicated number of animals (n). Comparisons between groups were performed by Student’s t-test.
Figure 1
Figure 1
K-ATPase activity in the gastric membrane vesicles of mice (A) Gastric K-ATPase activity was determined in the gastric membrane vesicles of wild type (WT), HKα1 knockout (α1 KO), and HKβ knockout (β KO) mice in the presence of 1 mM ouabain. Values (in micromole ATP hydrolyzed per mg membrane protein per hour) are means ± se from the indicated number of animals (n). (B) K-dependent ATPase activity was measured in the gastric membrane vesicles extracted from HKα1 wild type mice. K-ATPase activity of mouse gastric mucosa was fully stimulated by 1.0 mM K+. Inset, double-reciprocal plot of 1/V versus 1/[S] indicates apparent Km of 77 μM for the gastric K-ATPase activity. (C) Gastric K-ATPase activity was measured in the presence of 1 mM ouabain or in the presence of ouabain plus 100 μM Sch28080, or ouabain plus 100 μM orthovanadate. Values are means ± se from the indicated number of animals (n). Comparisons between groups were performed by Student’s t-test.
Fig. 2
Fig. 2
K-ATPase activity in the colonic membrane vesicles of mice. (A) Colonic K-ATPase activity was determined in the colonic membrane vesicles of HKα2 wild type (WT), HKα2 knockout (α2 KO), and HKβ knockout (β KO) mice. Values (in micromole ATP hydrolyzed per mg membrane protein per hour) are means ± se from the indicated number of animals (n). Comparisons between groups were performed by Student’s t-test. NS stands for no statistically significant difference between groups. (B) K-dependent ATPase activity was measured in the colonic membrane vesicles extracted from wild type mice. Maximal stimulation of K-ATPase activity was reached at K+ concentration of 200 μM. Inset, Lineweaver-Burk plot of 1/V versus 1/[S] indicates apparent Km of 40 μM for the colonic K-ATPase activity. (C) Colonic K-ATPase activity was measured in the absence of inhibitor or in the presence of 2 mM ouabain, or 100 μM Sch28080, or 100 μM orthovanadate. Values are means ± se from the indicated number of animals (n). * indicates P<0.001, statistically different from the colonic K-ATPase activity in the absence of inhibitor by Student’s t-test.
Fig. 2
Fig. 2
K-ATPase activity in the colonic membrane vesicles of mice. (A) Colonic K-ATPase activity was determined in the colonic membrane vesicles of HKα2 wild type (WT), HKα2 knockout (α2 KO), and HKβ knockout (β KO) mice. Values (in micromole ATP hydrolyzed per mg membrane protein per hour) are means ± se from the indicated number of animals (n). Comparisons between groups were performed by Student’s t-test. NS stands for no statistically significant difference between groups. (B) K-dependent ATPase activity was measured in the colonic membrane vesicles extracted from wild type mice. Maximal stimulation of K-ATPase activity was reached at K+ concentration of 200 μM. Inset, Lineweaver-Burk plot of 1/V versus 1/[S] indicates apparent Km of 40 μM for the colonic K-ATPase activity. (C) Colonic K-ATPase activity was measured in the absence of inhibitor or in the presence of 2 mM ouabain, or 100 μM Sch28080, or 100 μM orthovanadate. Values are means ± se from the indicated number of animals (n). * indicates P<0.001, statistically different from the colonic K-ATPase activity in the absence of inhibitor by Student’s t-test.
Fig. 3
Fig. 3
Effects of amiloride and derivatives on the colonic and gastric K-ATPase activity. (A) Colonic K-ATPase activity was measured as a function of the concentration of amiloride. (B) Gastric K-ATPase activity was measured as a function of the concentration of amiloride (□, solid line), or benzamil (○, dashed line), or EIPA (△, dotted line). (C) K-ATPase activity was measured as a function of the concentration of amiloride in the absence (■, solid line) or presence of 1 μM nigericin (●, short dashed line). Values are means ± se of 3 animals.
Fig. 3
Fig. 3
Effects of amiloride and derivatives on the colonic and gastric K-ATPase activity. (A) Colonic K-ATPase activity was measured as a function of the concentration of amiloride. (B) Gastric K-ATPase activity was measured as a function of the concentration of amiloride (□, solid line), or benzamil (○, dashed line), or EIPA (△, dotted line). (C) K-ATPase activity was measured as a function of the concentration of amiloride in the absence (■, solid line) or presence of 1 μM nigericin (●, short dashed line). Values are means ± se of 3 animals.

Similar articles

Cited by

References

    1. Gumz ML, Lynch IJ, Greenlee MM, Cain BD, Wingo CS. The Renal H+, K+ ATPases: Physiology, Regulation, and Structure. Am J Physiol Renal Physiol. 2009 - PMC - PubMed
    1. Asano S, Morii M, Takeguchi N. Molecular and cellular regulation of the gastric proton pump. Biol Pharm Bull. 2004;27:1–12. - PubMed
    1. Lecain E, Robert JC, Thomas A, Tran Ba Huy P. Gastric proton pump is expressed in the inner ear and choroid plexus of the rat. Hear Res. 2000;149:147–154. - PubMed
    1. Shull GE, Lingrel JB. Molecular cloning of the rat stomach (H+ + K+)-ATPase. The Journal of Biological Chemistry. 1986;261:16788–16791. - PubMed
    1. Hersey SJ, Sachs G. Gastric acid secretion. Physiol Rev. 1995;75:155–189. - PubMed

Publication types

MeSH terms