

Properties of the phage-shock-protein (Psp) regulatory complex that govern signal transduction and induction of the Psp response in Escherichia coli
- PMID: 20595257
- PMCID: PMC3068692
- DOI: 10.1099/mic.0.040055-0
Properties of the phage-shock-protein (Psp) regulatory complex that govern signal transduction and induction of the Psp response in Escherichia coli
Abstract
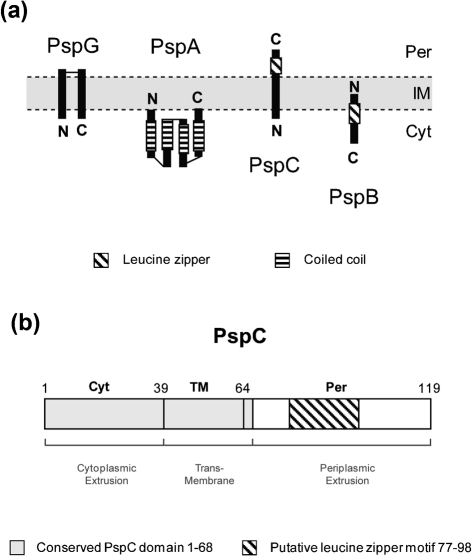
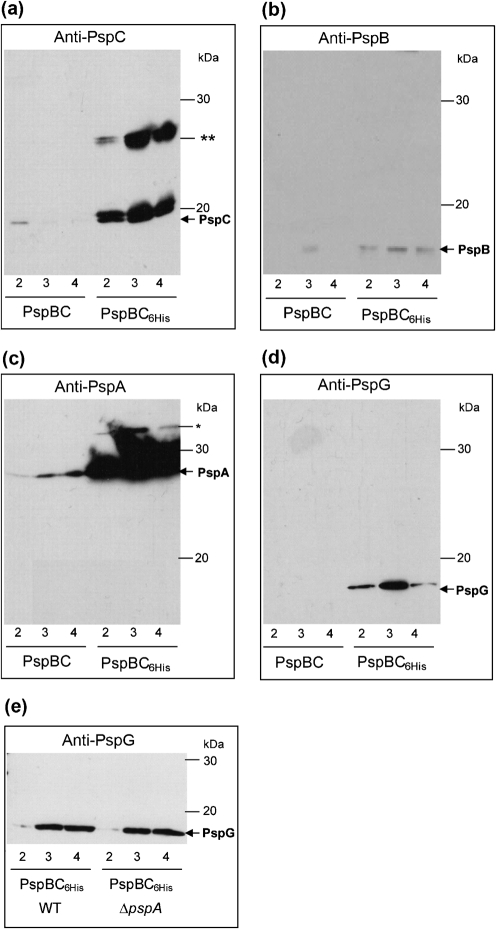
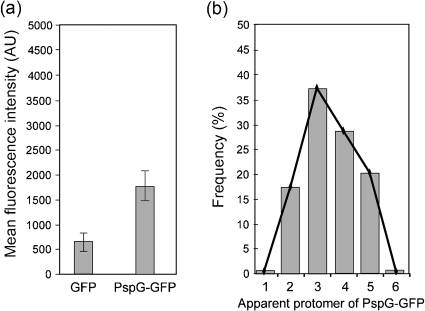
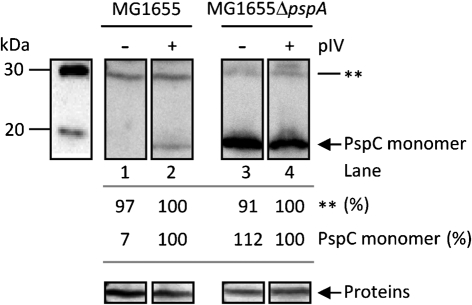
The phage-shock-protein (Psp) response maintains the proton-motive force (pmf) under extracytoplasmic stress conditions that impair the inner membrane (IM) in bacterial cells. In Escherichia coli transcription of the pspABCDE and pspG genes requires activation of σ(54)-RNA polymerase by the enhancer-binding protein PspF. A regulatory network comprising PspF-A-C-B-ArcB controls psp expression. One key regulatory point is the negative control of PspF imposed by its binding to PspA. It has been proposed that under stress conditions, the IM-bound sensors PspB and PspC receive and transduce the signal(s) to PspA via protein-protein interactions, resulting in the release of the PspA-PspF inhibitory complex and the consequent induction of psp. In this work we demonstrate that PspB self-associates and interacts with PspC via putative IM regions. We present evidence suggesting that PspC has two topologies and that conserved residue G48 and the putative leucine zipper motif are determinants required for PspA interaction and signal transduction upon stress. We also establish that PspC directly interacts with the effector PspG, and show that PspG self-associates. These results are discussed in the context of formation and function of the Psp regulatory complex.
Figures
 (pGJ60) and
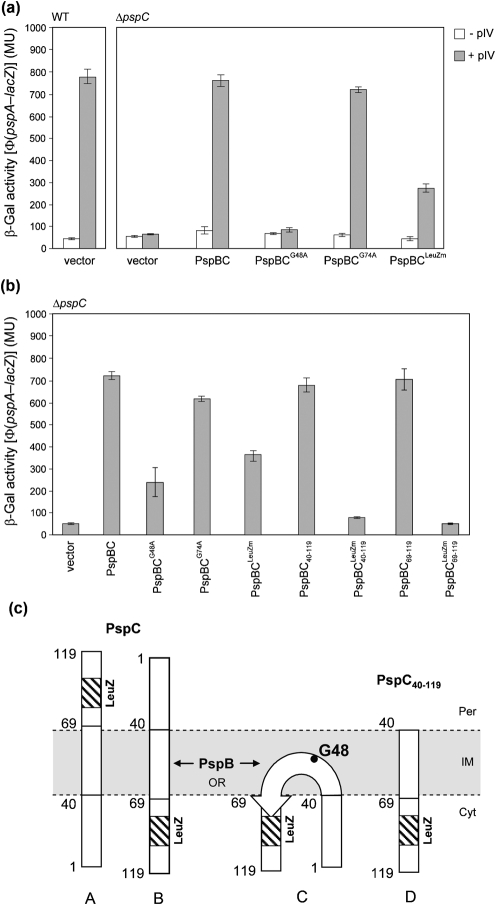
  (pGJ61) mutants failed to directly induce psp expression. Induction of the chromosomal Φ(pspA–lacZ) fusion in a ΔpspC strain (MVA13) by overexpression of PspBC or PspBC mutants (using 0.02 % Ara). (c) The PspC periplasmic region may exist in two topologies: schematic illustrating the potential topologies of PspC (A, B or C) and PspC40–119 (the periplasmic region containing the LeuZ; D).
Similar articles
-
In vivo localizations of membrane stress controllers PspA and PspG in Escherichia coli.Mol Microbiol. 2009 Aug;73(3):382-96. doi: 10.1111/j.1365-2958.2009.06776.x. Epub 2009 Jun 22. Mol Microbiol. 2009. PMID: 19555453 Free PMC article.
-
Induction and function of the phage shock protein extracytoplasmic stress response in Escherichia coli.J Biol Chem. 2006 Jul 28;281(30):21147-21161. doi: 10.1074/jbc.M602323200. Epub 2006 May 17. J Biol Chem. 2006. PMID: 16709570
-
Identification of a new member of the phage shock protein response in Escherichia coli, the phage shock protein G (PspG).J Biol Chem. 2004 Dec 31;279(53):55707-14. doi: 10.1074/jbc.M408994200. Epub 2004 Oct 13. J Biol Chem. 2004. PMID: 15485810
-
Recent findings about the Yersinia enterocolitica phage shock protein response.J Microbiol. 2012 Feb;50(1):1-7. doi: 10.1007/s12275-012-1578-7. Epub 2012 Feb 27. J Microbiol. 2012. PMID: 22367931 Free PMC article. Review.
-
Is the cellular and molecular machinery docile in the stationary phase of Escherichia coli?Biochem Soc Trans. 2015 Apr;43(2):168-71. doi: 10.1042/BST20140267. Biochem Soc Trans. 2015. PMID: 25849912 Review.
Cited by
-
Engineered Phage Enables Efficient Control of Gene Expression upon Infection of the Host Cell.Int J Mol Sci. 2024 Dec 30;26(1):250. doi: 10.3390/ijms26010250. Int J Mol Sci. 2024. PMID: 39796105 Free PMC article.
-
Whole-genome sequencing and identification of Morganella morganii KT pathogenicity-related genes.BMC Genomics. 2012;13 Suppl 7(Suppl 7):S4. doi: 10.1186/1471-2164-13-S7-S4. Epub 2012 Dec 13. BMC Genomics. 2012. PMID: 23282187 Free PMC article.
-
Membrane Stored Curvature Elastic Stress Modulates Recruitment of Maintenance Proteins PspA and Vipp1.mBio. 2015 Sep 1;6(5):e01188-15. doi: 10.1128/mBio.01188-15. mBio. 2015. PMID: 26330516 Free PMC article.
-
New functions for the ancient DedA membrane protein family.J Bacteriol. 2013 Jan;195(1):3-11. doi: 10.1128/JB.01006-12. Epub 2012 Oct 19. J Bacteriol. 2013. PMID: 23086209 Free PMC article. Review.
-
Comprehensive network of stress-induced responses in Zymomonas mobilis during bioethanol production: from physiological and molecular responses to the effects of system metabolic engineering.Microb Cell Fact. 2024 Jun 18;23(1):180. doi: 10.1186/s12934-024-02459-1. Microb Cell Fact. 2024. PMID: 38890644 Free PMC article. Review.
References
-
- Abramoff, M. D., Magelhaes, P. J. & Ram, S. J. (2004). Image processing with ImageJ. Biophotonics Int 11, 36–42.
-
- Becker, L. A., Bang, L.-S., Crouch, M.-L. & Fang, F. C. (2005). Compensatory role of PspA, a member of the phage shock protein operon, in rpoE mutant Salmonella enterica serovar Typhimurium. Mol Microbiol 56, 1004–1016. - PubMed
-
- Bergler, H., Abraham, D., Aschauer, H. & Turnowsky, F. (1994). Inhibition of lipid biosynthesis induces the expression of the pspA gene. Microbiology 140, 1937–1944. - PubMed
Publication types
MeSH terms
Substances
Grants and funding
LinkOut - more resources
Full Text Sources
Molecular Biology Databases
Research Materials
Miscellaneous