

The design and evaluation of a graphical display for laboratory data
- PMID: 20595309
- PMCID: PMC2995657
- DOI: 10.1136/jamia.2009.000505
The design and evaluation of a graphical display for laboratory data
Abstract
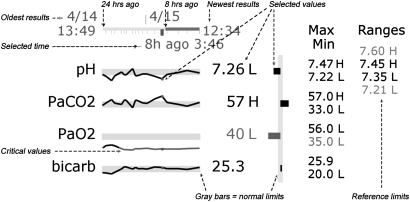
Objective: Advances in healthcare information technology have provided opportunities to present data in new, more effective ways. In this study, we designed a laboratory display that features small, data-dense graphics called sparklines, which have recently been promoted as effective representations of medical data but have not been well studied. The effect of this novel display on physicians' interpretation of data was investigated.
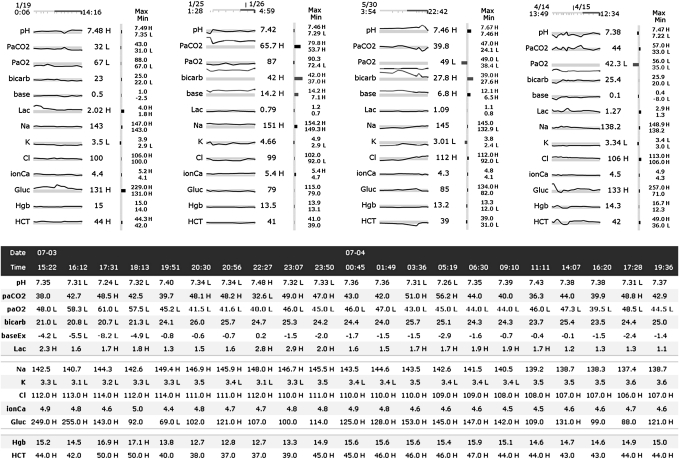
Design: Twelve physicians talked aloud as they assessed laboratory data from four patients in a pediatric intensive care unit with the graph display and with a conventional table display.
Measurements: Verbalizations were coded based on the abnormal values and trends identified for each lab variable. The correspondence of interpretations of variables in each display was evaluated, and patterns were investigated across participants. Assessment time was also analyzed.
Results: Physicians completed assessments significantly faster with the graphical display (3.6 min vs 4.4 min, p=0.042). When compared across displays, 37% of interpretations did not match. Graphs were more useful when the visual cues in tables did not provide trend information, while slightly abnormal values were easier to identify with tables.
Conclusions: Data presentation format can affect how physicians interpret laboratory data. Graphic displays have several advantages over numeric displays but are not always optimal. User, task and data characteristics should be considered when designing information displays.
Figures
References
-
- Bates DW, Gawande AA. Patient safety: improving safety with information technology. N Engl J Med 2003;348:2526–34 - PubMed
-
- Garg AX, Adhikari NKJ, McDonald H, et al. Effects of computerized clinical decision support systems on practitioner performance and patient outcomes—a systematic review. JAMA 2005;293:1223–38 - PubMed
-
- Kaushal R, Shojania KG, Bates DW. Effects of computerized physician order entry and clinical decision support systems on medication safety: a systematic review. Arch Intern Med 2003;163:1409–16 - PubMed
Publication types
MeSH terms
Grants and funding
LinkOut - more resources
Full Text Sources
Other Literature Sources
Miscellaneous
