. 2010 Sep 10;285(37):28991-9000.
doi: 10.1074/jbc.M110.101477. Epub 2010 Jul 1.

Cu,Zn superoxide dismutase maturation and activity are regulated by COMMD1

Affiliations

Cu,Zn superoxide dismutase maturation and activity are regulated by COMMD1

Willianne I M Vonk et al. J Biol Chem. .

Abstract

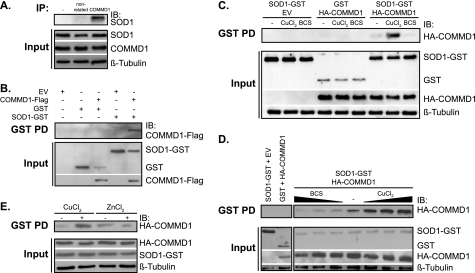
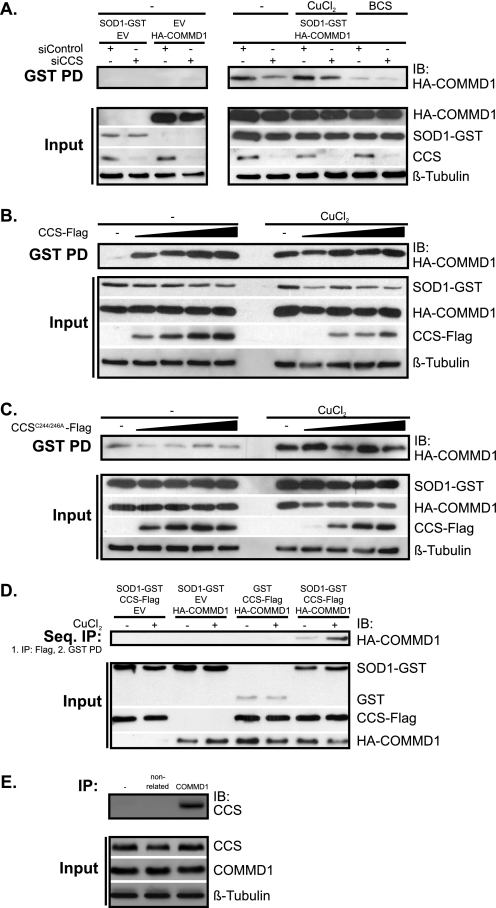
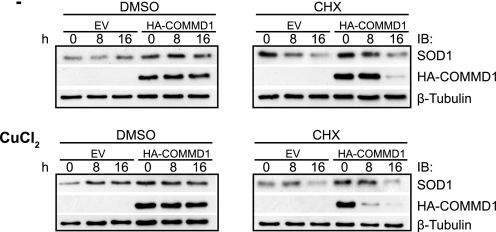
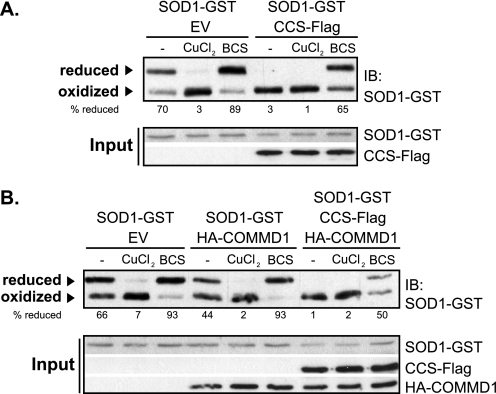
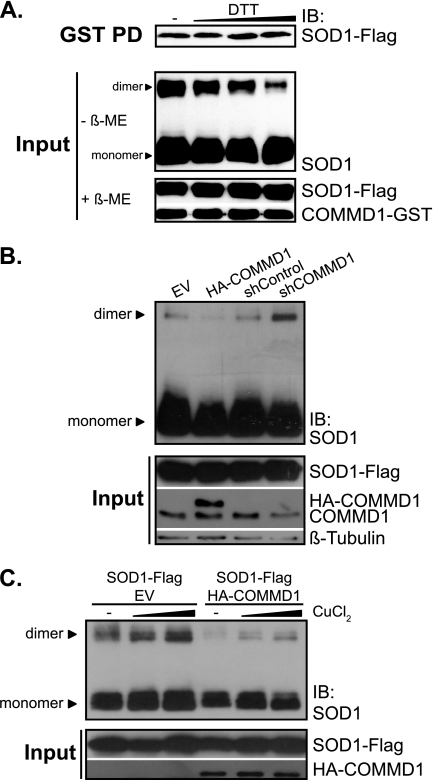
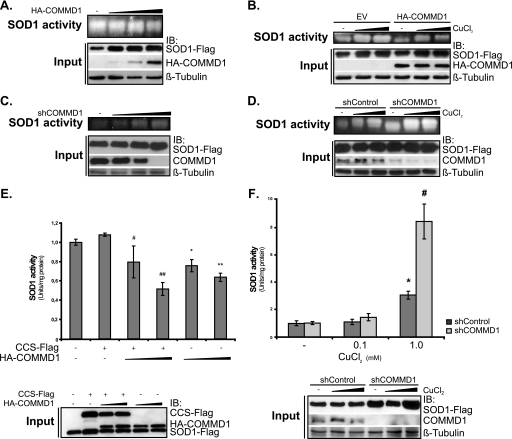
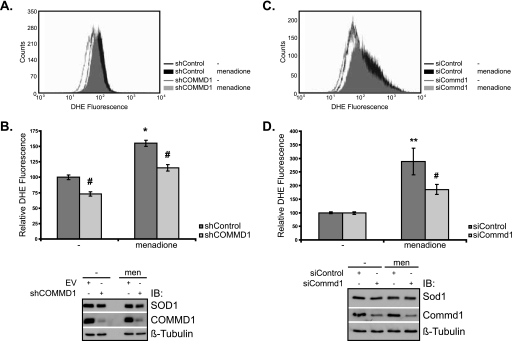
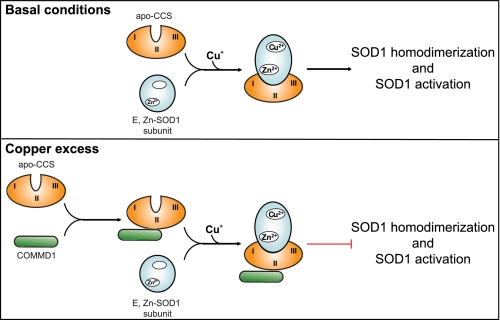
The maturation and activation of the anti-oxidant Cu,Zn superoxide dismutase (SOD1) are highly regulated processes that require several post-translational modifications. The maturation of SOD1 is initiated by incorporation of zinc and copper ions followed by disulfide oxidation leading to the formation of enzymatically active homodimers. Our present data indicate that homodimer formation is a regulated final step in SOD1 maturation and implicate the recently characterized copper homeostasis protein COMMD1 in this process. COMMD1 interacts with SOD1, and this interaction requires CCS-mediated copper incorporation into SOD1. COMMD1 does not regulate disulfide oxidation of SOD1 but reduces the level of SOD1 homodimers. RNAi-mediated knockdown of COMMD1 expression results in a significant induction of SOD1 activity and a consequent decrease in superoxide anion concentrations, whereas overexpression of COMMD1 exerts exactly the opposite effects. Here, we identify COMMD1 as a novel protein regulating SOD1 activation and associate COMMD1 function with the production of free radicals.


Figures

FIGURE 1.
FIGURE 1.
COMMD1 interacts with SOD1 in a copper-dependent manner. A, endogenous COMMD1 proteins were immunoprecipitated from HepG2 cell lysates. Immunoprecipitation was performed using protein A-agarose beads coupled to antibodies against COMMD1, isotype-control antibodies (nonrelated), or no antibodies (−). Precipitates (IP) or total cell lysates (Input; 30 μg) were analyzed by SDS-PAGE and immunoblotting (IB) using antibodies directed against SOD1 as indicated on the right side. B, HEK293T cells were transiently transfected with pEBB (empty vector, EV) or with constructs encoding COMMD1-FLAG, GST only, or SOD1-GST as indicated. GST fusion proteins were precipitated using glutathione-Sepharose beads. Precipitates (GST PD) or total cell lysates (Input; 20 μg) were analyzed by SDS-PAGE and immunoblotting (IB) using antibodies directed against the FLAG tag or GST as indicated on the right side. C, HEK293T cells were transiently transfected with empty vector or constructs encoding HA-COMMD1, GST only, or SOD1-GST as indicated above the figure. Cells were incubated overnight under basal conditions (−), with 150 μm CuCl2 or 200 μm BCS. Cells were lysed (lysis buffer supplemented with 1 mm CuCl2 or BCS, respectively), and GST fusion proteins were precipitated using GSH beads and analyzed as in B using antibodies directed against the HA tag, GST, or β-tubulin as indicated on the right side. D, HEK293T cells were transiently transfected with empty vector or constructs encoding HA-COMMD1, GST only, or SOD1-GST and incubated overnight under basal conditions (−), with increasing concentrations of CuCl2 (10, 50, and 150 μm) or BCS (10, 50, and 200 μm) as indicated. Cells were lysed in lysis buffer supplemented with similar concentrations of CuCl2 or BCS as incubation. GST fusion proteins were precipitated using GSH beads and analyzed as in C using antibodies directed against the HA tag, GST, or β-tubulin. Negative control samples (SOD1-GST + EV and GST + HA-COMMD1) were analyzed on a separate membrane. E, HEK293T cells were transiently transfected with constructs encoding HA-COMMD1 and SOD1-GST. Cells were incubated overnight under basal conditions (−), with 150 μm CuCl2 or 150 μm ZnCl2. Cells were lysed, and GST fusion proteins were precipitated and analyzed as in C.
FIGURE 2.
FIGURE 2.
Interaction between SOD1 and COMMD1 is mediated by CCS. A, HEK293T cells were transiently transfected with nontargeting siRNA ON-TARGETplus SMARTpools (siControl) or with siRNA ON-TARGETplus SMARTpools targeting CCS (siCCS). Cells were additionally transiently transfected with empty vector (EV) or constructs encoding HA-COMMD1 and SOD1-GST as indicated above the figure. Copper incubation, lysis, and GST precipitation were performed as in Fig. 1C. Immunoblot (IB) analysis was done using antibodies directed against the HA tag, CCS, GST, or β-tubulin as indicated on the right side. Negative control samples (SOD1-GST + EV and EV + HA-COMMD1) were analyzed on a separate membrane. B and C, HEK293T cells were transiently transfected with constructs encoding HA-COMMD1 and SOD1-GST, and variable amounts of constructs encoding CCS-FLAG (B) or CCSC244A/C246A-FLAG (C) as indicated above the figures. Cells were incubated overnight under basal conditions (−) or with 150 μm CuCl2. Cells were lysed, and GST fusion proteins were precipitated and analyzed as in Fig. 1B using antibodies directed against the HA tag, the FLAG tag, GST, or β-tubulin as indicated on the right side. D, HEK293T cells were transiently transfected with empty vector or constructs encoding CCS-FLAG, SOD1-GST, and HA-COMMD1. Cells were incubated overnight under basal conditions (−) or with 150 μm CuCl2. First, FLAG fusion proteins were precipitated using FLAG beads followed by protein elution from beads using FLAG peptides. Second, GST fusion proteins present in the eluates were precipitated using GSH-Sepharose beads and analyzed using antibodies directed against the HA tag, FLAG tag, or GST as indicated on the right side. E, endogenous COMMD1 proteins were immunoprecipitated from HepG2 cell lysates. Immunoprecipitation was performed using protein A-agarose beads coupled to antibodies against COMMD1, isotype-control antibodies (nonrelated), or no antibodies (−). Precipitates (IP) or total cell lysates (Input; 30 μg) were analyzed by SDS-PAGE and immunoblotting (IB) using antibodies directed against CCS as indicated on the right side.
FIGURE 3.
FIGURE 3.
SOD1 protein stability is not affected by COMMD1. HEK293T cells were transiently transfected with empty vector (EV) or a construct encoding HA-COMMD1 as indicated above the figure and incubated overnight under basal conditions (−) or with 150 μm CuCl2. Cells were additionally incubated for 0, 8, and 16 h with vehicle-control DMSO (left panel) or with 15 μg/ml cycloheximide (CHX, right panel). Cells were lysed as described under “Experimental Procedures.” Antibodies directed against endogenous SOD1, the HA tag, or β-tubulin as indicated on the right side were used for immunoblotting (IB).
FIGURE 4.
FIGURE 4.
Effect of COMMD1 on disulfide oxidation of SOD1 subunits. A, HEK293T cells were transiently transfected with SOD1-GST in combination with empty vector (EV) and CCS-FLAG and incubated overnight under basal conditions (−), with 150 μm CuCl2 or 200 μm BCS. Samples were prepared and analyzed as described under “Experimental Procedures.” Input samples (20 μg) were prepared in sample buffer supplemented with β-ME. For immunoblotting (IB), an antibody directed against the FLAG-tag was used as indicated on the right side. The migration of the disulfide-reduced and disulfide-oxidized forms of SOD1 is indicated. The indicated percentages represent the relative amount of reduced SOD1 in each sample. B, HEK293T cells were transiently transfected with constructs encoding SOD1-GST in combination with empty vector, HA-COMMD1, or HA-COMMD1 and CCS-FLAG and incubated overnight under basal conditions (−), with 150 μm CuCl2 or 200 μm BCS. Samples were prepared and analyzed as described in A using antibodies against GST, the HA tag, or the FLAG tag as indicated on the right side.
FIGURE 5.
FIGURE 5.
COMMD1 expression reduces the level of SOD1 homodimers. A, HEK293T cells were transiently transfected with constructs encoding SOD1-FLAG and COMMD1-GST. Cells were lysed in lysis buffer containing varying concentrations of DTT (0, 1, 10, and 100 mm, respectively). GST fusion proteins were precipitated from these same cell lysates and analyzed as in Fig. 1B using antibodies directed against the FLAG tag (upper panel; GST PD). SOD1 monomers and dimers were visualized by SDS-PAGE under nonreducing conditions and without boiling (Input; − β-ME) or after reduction with β-ME and boiling at 95 °C (Input; + β-ME). Expression of SOD1-FLAG and COMMD1-GST was monitored by immunoblot (IB) analysis using anti-FLAG and anti-GST antibodies. B, HEK293T cells were transiently transfected with constructs encoding SOD1-FLAG in combination with empty vector (EV) and HA-COMMD1 or in combination with pSUPER-RETRO vectors encoding nonspecific shRNA (shControl) or shRNA against COMMD1 (shCOMMD1). Samples (30 μg) were prepared and analyzed as described under “Experimental Procedures.” SDS-PAGE of SOD1 monomers and dimers was performed as described in A. Immunoblot analysis (IB) was performed using antibodies directed against endogenous SOD1, the FLAG tag, endogenous COMMD1, or β-tubulin as indicated on the right side. C, HEK293T cells were transiently transfected with constructs encoding SOD1-FLAG and empty vector or HA-COMMD1 and incubated for 1 h with CuCl2 (0, 0.1, or 1 mm, respectively). Visualization of SOD1 monomers and dimers by SDS-PAGE under nonreducing conditions and immunoblot analysis were preformed as described under B.
FIGURE 6.
FIGURE 6.
COMMD1 impairs SOD1 activity. A, HEK293T cells were transiently transfected with constructs encoding SOD1-FLAG in combination with varying amounts of HA-COMMD1. Cells were lysed, and SOD1 activity was determined in 50 μg of cell lysates by the in-gel activity assay as described under “Experimental Procedures” (upper panels). Expression of SOD1-FLAG, COMMD1, and β-tubulin was monitored in 20 μg of the cell lysates by reducing, denaturing SDS-PAGE followed by immunoblot analysis (IB) using FLAG, HA, or β-tubulin antibodies as indicated (lower panels; Input). B, Neuro2A cells were transiently transfected with SOD1-FLAG in combination with constructs encoding empty vector (EV) or HA-COMMD1. Cells were incubated for 1 h with CuCl2 (0, 0.1, or 1 mm, respectively). Visualization of SOD1 activity (upper panels) and immunoblot analysis (lower panels; Input) were performed as described in A. C, HEK293T cells were transiently transfected with SOD1-FLAG in combination with increasing concentrations of shCOMMD1. Cells were lysed and analyzed as described in A. D, HEK293T cells were transiently transfected with SOD1-FLAG in combination with shControl or shCOMMD1. Sample preparation and analysis was performed as described for B. E, HEK293T cells were transiently transfected with SOD1-FLAG in combination with empty vector or CCS-FLAG and varying amounts of HA-COMMD1. Cells were lysed, and SOD1 activity was measured by formation of formazan upon reduction with superoxide anion. Obtained values were corrected for protein concentration and normalized for basal conditions, which was set at 1. For each sample, mean values ± S.D. are shown (n = 4). Data represent three independent experiments. * and ** indicate significantly different values compared with SOD1-FLAG-transfected cells (*, p < 0.05; **, p < 0.001). # and ## indicate significantly different values compared with SOD1-FLAG and CCS-FLAG co-transfected cells (# p < 0.05, ## p < 0.005). Expression of SOD1-FLAG, CCS-FLAG, and HA-COMMD1 in cell lysates (20 μg of protein) was monitored by immunoblot analysis using the indicated antibodies (Input; panel below graph). F, HEK293T cells were transiently transfected with constructs encoding SOD1-FLAG in combination with shControl and shCOMMD1 plasmids and incubated under basal conditions (−) or for 1 h with CuCl2 (0.1 and 1 mm, respectively). Cells were grown under basal conditions. SOD1 activity was analyzed as described in E. For each sample, mean values ± S.D. are shown (n = 3). Data represent three independent experiments. * indicates significantly different values compared with untreated and 0.1 mm CuCl2-treated cells; p < 0.001. # indicates significantly different values compared with shControl-transfected cells treated with 1.0 mm CuCl2; p < 0.001. Expression of SOD1-FLAG, COMMD1, and β-tubulin in cell lysates (20 μg of protein) was monitored by immunoblot analysis using the indicated antibodies (Input; panel below graph).
FIGURE 7.
FIGURE 7.
COMMD1 expression induces intracellular superoxide anion concentrations. A and B, intracellular superoxide anion concentrations were assessed by DHE fluorescence using FACS analysis in HEK293T cells stably transfected with shControl or shCOMMD1. Cells were incubated under basal conditions (−) or with 50 μm menadione for 2 h prior to DHE loading (3 μm for 30 min, 37 °C) and analyzed on a FACSCalibur flow cytometer. Data represent DHE fluorescence of 25,000 cells. A, FACSCalibur fluorescence histogram representing shControl (black) and COMMD1 knockdown cells (gray), loaded with DHE, after incubation without (open curves) or with menadione (filled curves). B, relative DHE fluorescence. Values obtained in A were normalized for shControl basal conditions, which was set at 100%. For each sample, mean values ± S.D. are shown (n = 3). Data are representative of three experiments (n = 3). * indicates significant increase in DHE fluorescence of cells grown under basal conditions or after incubation with menadione; p < 0.001. # indicates significant decline in measured DHE fluorescence of shControl cells compared with shCOMMD1 expressing HEK293T; p < 0,001. Expression of SOD1, COMMD1, and β-tubulin in 20 μg of cell lysates was monitored by immunoblot analysis using the indicated antibodies (panel below graph; −, basal conditions; men, incubation with 50 μm menadione). C and D, Neuro2A cells were transiently transfected with nontargeting siRNA ON-TARGETplus SMARTpools (siControl) or with siRNA ON-TARGETplus SMARTpools targeting mouse Commd1 (siCommd1). Cells were treated with menadione and DHE, and DHE fluorescence was analyzed as described in A and B. C, FACSCalibur fluorescence histogram representing siControl (black) and Commd1 knock-down cells (gray), loaded with DHE, after incubation without (open curves) or with menadione (filled curves). D, relative DHE fluorescence. Values obtained in C were normalized for siControl basal conditions, which were set at 100%. For each sample, mean values ± S.D. are shown (n = 3). Data are representative of three experiments (n = 3). ** indicates significant increase in measured DHE fluorescence of cells grown under basal conditions or after incubation with menadione; p < 0.001. # indicates significant decline in measured DHE fluorescence of siControl cells compared with siCommd1 expressing cells; p < 0.01. Immunoblot analysis was performed as in B (panel below graph).
FIGURE 8.
FIGURE 8.
Hypothetical model, COMMD1 reduces CCS-mediated activation of SOD1 by impairment of SOD1 dimerization. Schematic representation of SOD1 post-translational activation, adapted from Refs. , . Under basal conditions (upper panel), CCS delivers copper to monomeric zinc-containing apo-SOD1 (E,Zn-SOD1 subunit) by transient interaction. This transfer of copper ions involves the formation of an intermolecular disulfide bond between SOD1 and CCS. Copper incorporation is followed by dissociation of CCS from SOD1 prior to disulfide oxidation of cysteine residues 57 and 146 of SOD1. This results in SOD1 homodimerization and induction of the superoxide scavenging activity of SOD1. In excess copper (lower panel), COMMD1-bound CCS interacts with SOD1 leading to formation of COMMD1-CCS-SOD1 heterocomplex. Consequently, SOD1 homodimerization is impaired resulting in decreased level of SOD1 homodimers and subsequently reduced SOD1 anti-oxidant activity.

Similar articles

Cited by

References

    1. Fridovich I. (1986) Adv. Enzymol. Relat. Areas Mol. Biol. 58, 61–97 - PubMed
    1. Goto J. J., Zhu H., Sanchez R. J., Nersissian A., Gralla E. B., Valentine J. S., Cabelli D. E. (2000) J. Biol. Chem. 275, 1007–1014 - PubMed
    1. Petrovic N., Comi A., Ettinger M. J. (1996) J. Biol. Chem. 271, 28331–28334 - PubMed
    1. Brown N. M., Torres A. S., Doan P. E., O'Halloran T. V. (2004) Proc. Natl. Acad. Sci. U.S.A. 101, 5518–5523 - PMC - PubMed
    1. Culotta V. C., Klomp L. W., Strain J., Casareno R. L., Krems B., Gitlin J. D. (1997) J. Biol. Chem. 272, 23469–23472 - PubMed

Publication types

LinkOut - more resources