. 2010 Sep 3;285(36):27911-23.
doi: 10.1074/jbc.M110.134163. Epub 2010 Jul 1.

Versatility of trigger factor interactions with ribosome-nascent chain complexes

Affiliations

Versatility of trigger factor interactions with ribosome-nascent chain complexes

Sathish Kumar Lakshmipathy et al. J Biol Chem. .

Abstract

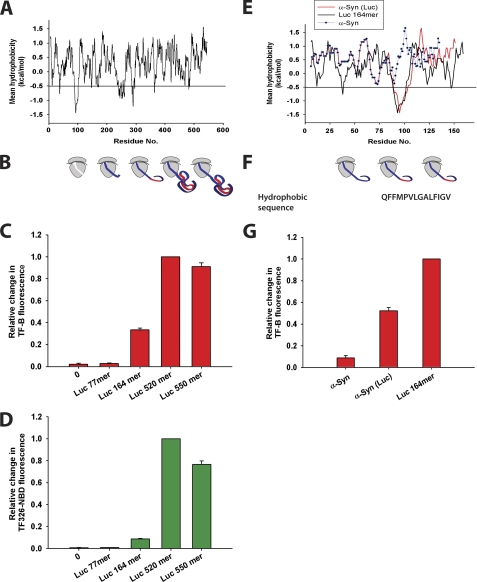
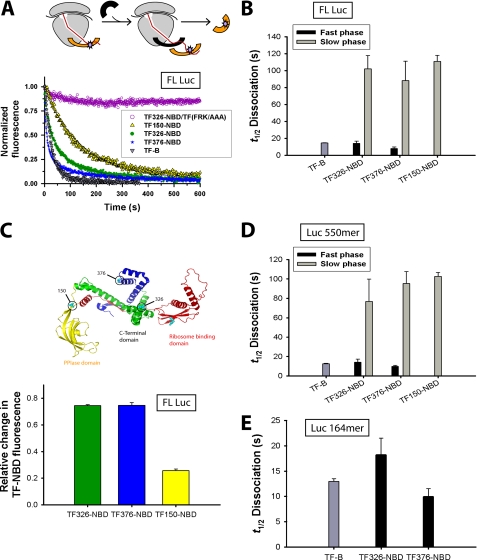
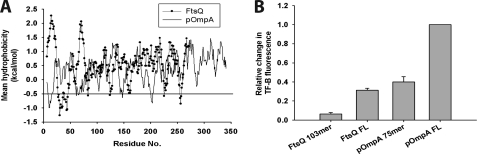
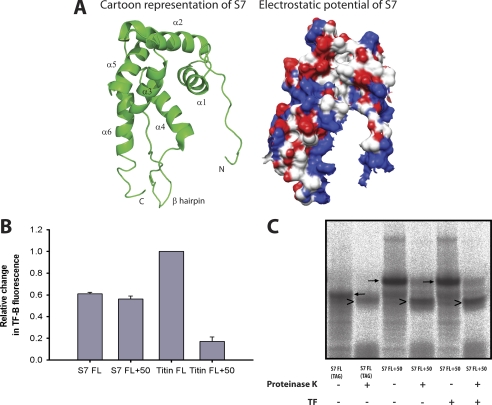
Trigger factor (TF) is the first molecular chaperone that interacts with nascent chains emerging from bacterial ribosomes. TF is a modular protein, consisting of an N-terminal ribosome binding domain, a PPIase domain, and a C-terminal domain, all of which participate in polypeptide binding. To directly monitor the interactions of TF with nascent polypeptide chains, TF variants were site-specifically labeled with an environmentally sensitive NBD fluorophore. We found a marked increase in TF-NBD fluorescence during translation of firefly luciferase (Luc) chains, which expose substantial regions of hydrophobicity, but not with nascent chains lacking extensive hydrophobic segments. TF remained associated with Luc nascent chains for 111 +/- 7 s, much longer than it remained bound to the ribosomes (t((1/2)) approximately 10-14 s). Thus, multiple TF molecules can bind per nascent chain during translation. The Escherichia coli cytosolic proteome was classified into predicted weak and strong interactors for TF, based on the occurrence of continuous hydrophobic segments in the primary sequence. The residence time of TF on the nascent chain generally correlated with the presence of hydrophobic regions and the capacity of nascent chains to bury hydrophobicity. Interestingly, TF bound the signal sequence of a secretory protein, pOmpA, but not the hydrophobic signal anchor sequence of the inner membrane protein FtsQ. On the other hand, proteins lacking linear hydrophobic segments also recruited TF, suggesting that TF can recognize hydrophobic surface features discontinuous in sequence. Moreover, TF retained significant affinity for the folded domain of the positively charged, ribosomal protein S7, indicative of an alternative mode of TF action. Thus, unlike other chaperones, TF appears to employ multiple mechanisms to interact with a wide range of substrate proteins.


Figures

FIGURE 1.
FIGURE 1.
TF interactions with nascent chains during translation in real time. A, crystal structure of E. coli TF (PDB code 1w26), with the N-terminal domain shown in red, the PPIase domain in yellow, and arm 1 and arm 2 of the C-terminal domain in green and blue, respectively. Engineered cysteines to which the NBD or BADAN probes were covalently bound are indicated by black circles and their amino acid number. B, determination of the specific activity of Luc in the absence (control) or presence of 5 μm WT TF, TF150-NBD, TF326-NBD, or TF376-NBD. The specific activity of Luc upon translation in the PURE system was normalized with respect to the control (set to 1). Standard deviations from three independent experiments are shown. C, in vitro translation of Luc in the PURE system in the presence of either 1 μm TF326-NBD (green) or TF(FRK/AAA)326-NBD (purple) and translation of α-Syn (gray) in the presence of TF326-NBD. D, in vitro translation of Luc in the presence of either 1 μm TF-B (green) or TF(FRK/AAA)-B (purple) and translation of α-Syn (gray) in the presence of TF-B. Translations were initiated by the addition of the respective DNA templates and performed at 30 °C. E, a representative autoradiograph of Luc and α-Syn translation kinetics during a real-time experiment with aliquots taken at various time points as indicated.
FIGURE 2.
FIGURE 2.
Recruitment of TF toward Luc RNCs of increasing length. A, hydrophobicity analysis of the firefly luciferase sequence (Luc) was performed as previously published (16). The predicted value of threshold hydrophobicity for TF binding is shown as a black line. B, schematic diagram of ribosomes displaying increasing lengths of Luc nascent chains exposing hydrophobic regions (red). The nascent chains were translated in the presence of either 1 μm TF-B or TF326-NBD. Bar diagram displaying the relative change in TF-B fluorescence (C) (red) and TF326-NBD fluorescence (D) (green) during translation of different lengths of Luc nascent chains as indicated. The fluorescence change of TF-B and TF326-NBD is shown relative to Luc 520-mer (set to 1). E, hydrophobicity analysis of α-Syn (blue), Luc 164-mer (black), and α-Syn (Luc) (red) sequences was performed as above. F, schematic representation of ribosomes displaying the hydrophobic region in α-Syn (Luc) and Luc 164-mer nascent chains (red). The sequence of the hydrophobic region present in α-Syn (Luc) and Luc 164-mer is shown. G, bar diagram displaying the relative change in TF-B fluorescence during translation of ribosome-stalled α-Syn, α-Syn (Luc), or Luc 164-mer nascent chains. TF-B fluorescence change is shown relative to Luc 164-mer (set to 1). Standard deviations from three independent experiments are shown in C, D, and G.
FIGURE 3.
FIGURE 3.
Dissociation of TF-NBD from Luc RNCs. A, dissociation of TF326-NBD (green), TF376-NBD (blue), TF150-NBD (yellow), or TF-B (gray) by addition of 20 μm WT TF from FL Luc RNCs once steady-state fluorescence values had been achieved during in vitro translation. Dissociation of TF326-NBD was also measured upon addition of 20 μm TF (FRK/AAA) (purple). B, bar diagram of the t½ for TF-NBD dissociation from FL Luc RNCs from reactions in A. The dissociation of TF326-NBD and TF376-NBD was best fit to a double exponential function (fast phase is shown in black and slow phase in gray) and dissociation of TF150-NBD was best fit to a single exponential function. C, top panel, crystal structure of E. coli TF displaying the sites to which the NBD probe was covalently bound. Bottom panel, bar diagram displaying the relative change in TF326-NBD (green), TF376-NBD (blue), and TF150-NBD fluorescence (yellow) during translation of FL Luc. D and E, the t½ values for TF-NBD dissociation from Luc 550-mer RNCs (D) and Luc 164-mer RNCs (E) are shown. The t½ values of TF-B dissociation from the respective RNCs are shown in B, D, and E. Standard deviations from at least three independent experiments are shown.
FIGURE 4.
FIGURE 4.
Dynamics of TF interactions with predicted weak and strong interactors. Recruitment of TF-B (A) and TF326-NBD (B) toward stalled RNCs of predicted weak interactors (S7, RRF, GRPE, SPOR, METF, HISG, RLMG, METK, and HEMA) (black) or predicted strong interactors (AROE, RIMK, GATD, and DCP) (gray) of TF. The relative change in TF-B and TF326-NBD fluorescence measured after saturation was reached was corrected for the amount of radiolabeled protein. The fluorescence change of TF-B and TF326-NBD is shown relative to DCP (set to 1). Standard deviations from at least three independent experiments are shown. Molecular weight and absolute hydrophobicity of the protein sequences are shown. Hydrophobicity scale of Kyte and Doolittle (39) was used to calculate absolute hydrophobicity.
FIGURE 5.
FIGURE 5.
Dissociation of TF326-NBD from the RNCs of predicted weak and strong interactors. A, bar diagram of the t½ values for TF326-NBD dissociation from RNCs of SPOR (black) and RNCs of the predicted strong interactors AROE, RIMK, GATD, and DCP (gray). The dissociation of TF326-NBD from all the above RNCs was best fit to a single exponential function. Standard deviations from at least three independent experiments are shown. B, ribbon diagram of the crystal structure of E. coli shikimate dehydrogenase (AROE) (PDB code 1NYT). Residues 1–101, comprising domain I, and residues 102–232, comprising domain II, are shown in red and green, respectively. C-terminal 39 residues (233–272) are shown in blue. C, ribbon diagram of the crystal structure of E. coli DCP (PDB code 1Y79). Residues 1–146, 351–539, and 611–640 forming domain I are shown in red. Residues 147–350 and 540–610 forming domain II are shown in green. C-terminal residues 641–680, located in the ribosomal exit tunnel prior to the release of the full-length chain, are shown in blue. Structures were generated with PyMOL (51).
FIGURE 6.
FIGURE 6.
Interaction of TF with RNCs of inner membrane and secretory proteins. A, hydrophobicity analysis of the FtsQ (black circles) and pOmpA (black line) sequences were performed as described in the legend to Fig. 2. B, bar diagram displaying the relative change in TF-B fluorescence during translation of ribosome-stalled FtsQ 103-mer, FtsQ FL, pOmpA 75-mer, and pOmpA FL. The fluorescence change of TF-B is shown relative to pOmpA (set to 1). Standard deviations from at least three independent experiments are shown.
FIGURE 7.
FIGURE 7.
Interaction of TF with RNCs of the ribosomal protein S7. A, ribbon diagram and electrostatic surface potential of the crystal structure of S7 from the intact E. coli ribosome and shown in the same orientation (PDB code 2AVY). Surfaces are shown in degrees of positive (blue) and negative (red) potential. Electrostatic potential was generated with Chimera (50). B, the maximal relative change in TF-B fluorescence, reflecting TF recruitment to the ribosome, measured with nascent chains of S7 FL, S7 FL+50, Titin FL, and Titin FL+50. Values were corrected for the amount of radiolabeled protein synthesized. The fluorescence change of TF-B with Titin FL is set to 1. C, proteinase K digestion of S7 FL (TAG) (ribosome released S7) or S7 FL+50 nascent chains. The nascent chains were translated in the PURE system for ∼50 min in the presence of [35S]methionine. S7 FL+50 nascent chains were translated in the presence or absence of 5 μm TF. The reactions were digested with Proteinase K for 8 min on ice and analyzed by SDS-PAGE. Black arrows indicate nascent chains, arrowheads indicate protease-protected fragments.

Similar articles

Cited by

References

    1. Kramer G., Boehringer D., Ban N., Bukau B. (2009) Nat. Struct. Mol. Biol. 16, 589–597 - PubMed
    1. Hartl F. U., Hayer-Hartl M. (2009) Nat. Struct. Mol. Biol. 16, 574–581 - PubMed
    1. Hartl F. U. (1996) Nature 381, 571–579 - PubMed
    1. Frydman J., Erdjument-Bromage H., Tempst P., Hartl F. U. (1999) Nat. Struct. Biol. 6, 697–705 - PubMed
    1. Lu J., Deutsch C. (2005) Nat. Struct. Mol. Biol. 12, 1123–1129 - PubMed

LinkOut - more resources