. 2010 Jul 2;329(5987):89-93.
doi: 10.1126/science.1188989.

An early T cell lineage commitment checkpoint dependent on the transcription factor Bcl11b

Affiliations

An early T cell lineage commitment checkpoint dependent on the transcription factor Bcl11b

Long Li et al. Science. .

Abstract

The identities of the regulators that mediate commitment of hematopoietic precursors to the T lymphocyte lineage have been unknown. The last stage of T lineage commitment in vivo involves mechanisms to suppress natural killer cell potential, to suppress myeloid and dendritic cell potential, and to silence the stem cell or progenitor cell regulatory functions that initially provide T cell receptor-independent self-renewal capability. The zinc finger transcription factor Bcl11b is T cell-specific in expression among hematopoietic cell types and is first expressed in precursors immediately before T lineage commitment. We found that Bcl11b is necessary for T lineage commitment in mice and is specifically required both to repress natural killer cell-associated genes and to down-regulate a battery of stem cell or progenitor cell genes at the pivotal stage of commitment.


Figures
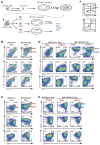
Fig. 1
Fig. 1
Generation and developmental arrest of Bcl11b-deficient T cell precursors. (A) Experimental scheme. Fetal liver precursors (Linc-kit+ CD27+; FLP) from embryonic day 13.5 embryos or bone marrow hematopoietic stem cells (BM LSK) were isolated from Bcl11bL2/L2 or wild-type mice, transduced with hNGFR-Cre retrovirus, and sorted 48 hours later and cocultured with OP9-DL1 cells. After 9 days of culture, DN subsets of cells were sorted (red populations). A fraction of each subset was returned to OP9-DL1 coculture for later analysis (blue populations). The remaining cells were analyzed for RNA expression. (B) Flow cytometric analysis of transduced fetal liver–derived precursors after 9 days of OP9-DL1 coculture. (C) As in (B), for bone marrow–derived precursors after 14 days of OP9-DL1 coculture. (D) Flow cytometric analysis of sorted DN2a and DN2b cells from fetal liver precursors after an additional 12 days of OP9-DL1 coculture. (E) As in (D), but for sorted DN2a and DN2b cells from bone marrow precursors. (F) Schematic of normal differentiation.
Fig. 2
Fig. 2
Non–T lineage differentiation of Bcl11b-deleted DN2 and DN1-like cells. (A) Flow cytometric analysis of B220, CD11c, and NK1.1 coexpression on progeny of DN2a and DN2b precursors in OP9-DL1 secondary culture. (B) Flow cytometric analysis of cells derived from DN2 precursors transferred to OP9 control secondary culture. (C) Myeloid developmental competence of T cell precursors from control and Bcl11b-deficient precursors. DN1, DN2a, and DN2b cells were generated from bone marrow precursors in primary culture with OP9-DL1 (see fig. S3), sorted after ~20 days, and transferred to OP9 control secondary cultures supplemented with macrophage colony-stimulating factor only. Flow cytometric analyses of Mac1 and Gr-1 expression are shown. Results in each panel are from different independent, single experiments, each representative of three or four experiments.
Fig. 3
Fig. 3
Gene expression comparison between normal and Bcl11b-deleted cells in early T cell development in vitro. Subsets of control and Bcl11b-deleted cells were sorted both after primary 9-day culture and after secondary culture as indicated. For sorting gates and quantitation of expression levels in fixed units, see fig. S7. “DN4” cells generated by controls in secondary culture may include later stages. Real-time quantitative polymerase chain reaction data are shown as a heat map normalized to levels of each gene in control DN2a cells. Color scale units are log10 for a 104 overall range. Vertical bars on right highlight gene groups of interest. Results are from one of four representative experiments (independent experiments are shown in figs. S8 and S9).

Comment in

Similar articles

Cited by

References

    1. Rothenberg EV, Moore JE, Yui MA. Nat Rev Immunol. 2008;8:9. - PMC - PubMed
    1. Yui MA, Feng N, Rothenberg EV. J Immunol. 2010 doi: 10.4049/jimmunol.1000679. - DOI - PMC - PubMed
    1. O’Neil J, Shank J, Cusson N, Murre C, Kelliher M. Cancer Cell. 2004;5:587. - PubMed
    1. Herblot S, Steff AM, Hugo P, Aplan PD, Hoang T. Nat Immunol. 2000;1:138. - PubMed
    1. Zhong Y, Jiang L, Hiai H, Toyokuni S, Yamada Y. Oncogene. 2007;26:6937. - PubMed

Publication types

MeSH terms