

Exposure of precision-cut rat liver slices to ethanol accelerates fibrogenesis
- PMID: 20595623
- PMCID: PMC2950678
- DOI: 10.1152/ajpgi.00287.2009
Exposure of precision-cut rat liver slices to ethanol accelerates fibrogenesis
Abstract
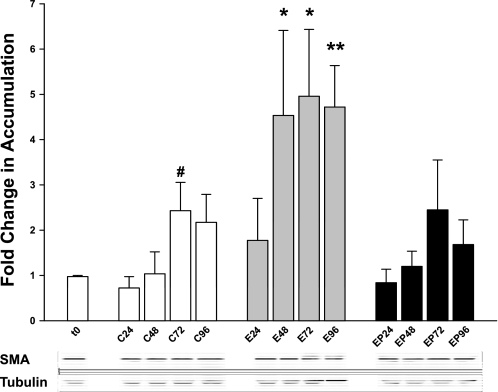
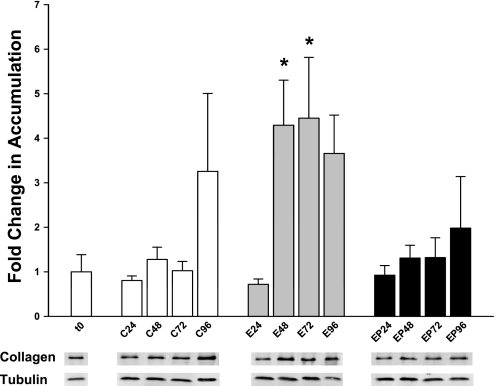
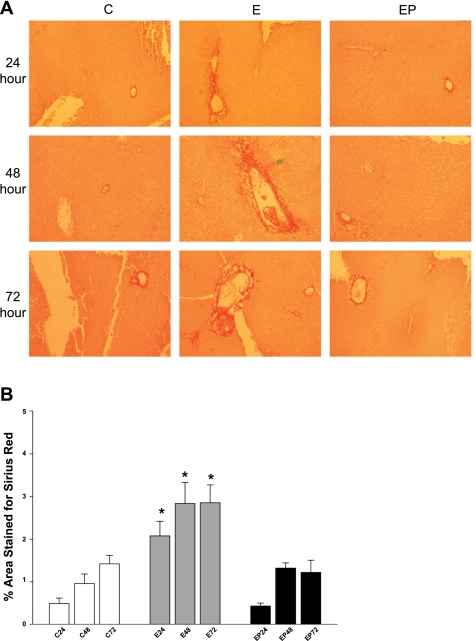
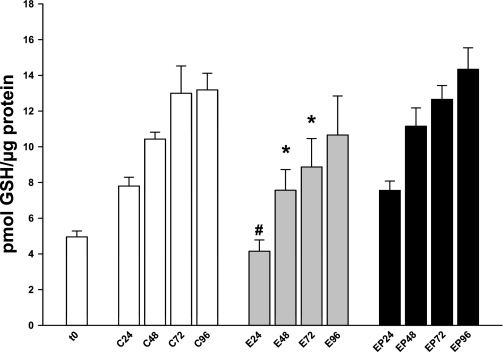
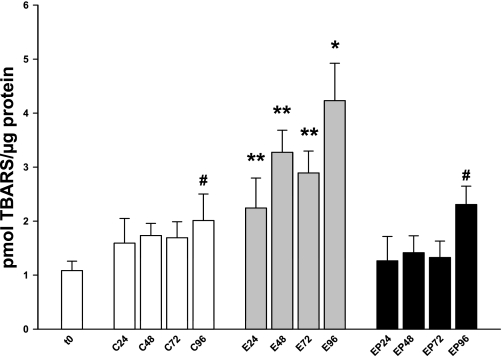
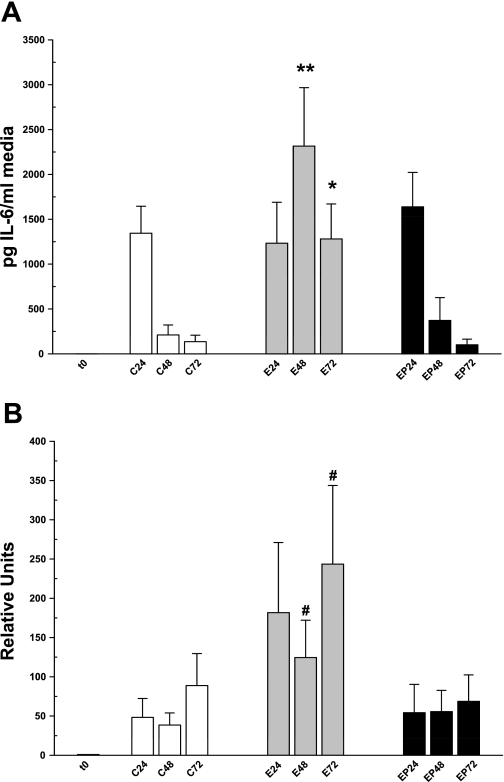
Ethanol metabolism in the liver induces oxidative stress and altered cytokine production preceding myofibroblast activation and fibrogenic responses. The purpose of this study was to determine how ethanol affects the fibrogenic response in precision-cut liver slices (PCLS). PCLS were obtained from chow-fed male Wistar rats (200-300 g) and were cultured up to 96 h in medium, 25 mM ethanol, or 25 mM ethanol and 0.5 mM 4-methylpyrazole (4-MP), an inhibitor of ethanol metabolism. Slices from every time point (24, 48, 72, and 96 h) were examined for glutathione (GSH) levels, lipid peroxidation [thiobarbituric acid-reactive substance (TBARS) assay], cytokine production (ELISA and RT-PCR), and myofibroblast activation [immunoblotting and immunohistochemistry for smooth muscle actin (SMA) and collagen]. Treatment of PCLS with 25 mM ethanol induced significant oxidative stress within 24 h, including depletion of cellular GSH and increased lipid peroxidation compared with controls (P < 0.05). Ethanol treatment also elicited a significant and sustained increase in interleukin-6 (IL-6) production (P < 0.05). Importantly, ethanol treatment accelerates a fibrogenic response after 48 h, represented by significant increases in SMA and collagen 1alpha(I) production (P < 0.05). These ethanol-induced effects were prevented by the addition of 4-MP. Ethanol metabolism induces oxidative stress (GSH depletion and increased lipid peroxidation) and sustained IL-6 expression in rat PCLS. These phenomena precede and coincide with myofibroblast activation, which occurs within 48 h of treatment. These results indicate the PCLS can be used as in vitro model for studying multicellular interactions during the early stages of ethanol-induced liver injury and fibrogenesis.
Figures
Similar articles
-
Review: Precision Cut Liver Slices for the Evaluation of Fatty Liver and Fibrosis.Curr Mol Pharmacol. 2017;10(3):249-254. doi: 10.2174/1874467208666150817112345. Curr Mol Pharmacol. 2017. PMID: 26278387 Review.
-
Precision-cut liver slices from diet-induced obese rats exposed to ethanol are susceptible to oxidative stress and increased fatty acid synthesis.Am J Physiol Gastrointest Liver Physiol. 2014 Feb;306(3):G208-17. doi: 10.1152/ajpgi.00124.2013. Epub 2013 Nov 27. Am J Physiol Gastrointest Liver Physiol. 2014. PMID: 24284960 Free PMC article.
-
Regression of liver fibrosis by taurine in rats fed alcohol: effects on collagen accumulation, selected cytokines and stellate cell activation.Eur J Pharmacol. 2010 Nov 25;647(1-3):161-70. doi: 10.1016/j.ejphar.2010.08.011. Epub 2010 Sep 4. Eur J Pharmacol. 2010. PMID: 20813107
-
Effect of indole-3-carbinol on ethanol-induced liver injury and acetaldehyde-stimulated hepatic stellate cells activation using precision-cut rat liver slices.Clin Exp Pharmacol Physiol. 2010 Dec;37(12):1107-13. doi: 10.1111/j.1440-1681.2010.05450.x. Clin Exp Pharmacol Physiol. 2010. PMID: 20880187
-
Fluvastatin attenuates hepatic steatosis-induced fibrogenesis in rats through inhibiting paracrine effect of hepatocyte on hepatic stellate cells.BMC Gastroenterol. 2015 Feb 15;15:22. doi: 10.1186/s12876-015-0248-8. BMC Gastroenterol. 2015. PMID: 25886887 Free PMC article.
Cited by
-
Protective effect of Ganoderma lucidum polysaccharide against carbon tetrachloride-induced hepatic damage in precision-cut carp liver slices.Fish Physiol Biochem. 2017 Oct;43(5):1209-1221. doi: 10.1007/s10695-016-0333-0. Epub 2017 Jul 5. Fish Physiol Biochem. 2017. PMID: 28681206
-
LX-2 Stellate Cells Are a Model System for Investigating the Regulation of Hepatic Vitamin A Metabolism and Respond to Tumor Necrosis Factor α and Interleukin 1β.Drug Metab Dispos. 2024 Apr 16;52(5):442-454. doi: 10.1124/dmd.124.001679. Drug Metab Dispos. 2024. PMID: 38485281 Free PMC article.
-
Assessment of immunotoxicity using precision-cut tissue slices.Xenobiotica. 2013 Jan;43(1):84-97. doi: 10.3109/00498254.2012.731543. Epub 2012 Nov 16. Xenobiotica. 2013. PMID: 23199366 Free PMC article. Review.
-
Activation of cardiac fibroblasts by ethanol is blocked by TGF-β inhibition.Alcohol Clin Exp Res. 2013 Aug;37(8):1286-94. doi: 10.1111/acer.12111. Epub 2013 Mar 25. Alcohol Clin Exp Res. 2013. PMID: 23528014 Free PMC article.
-
Free radical detection in precision-cut mouse liver slices with diamond-based quantum sensing.Proc Natl Acad Sci U S A. 2024 Oct 22;121(43):e2317921121. doi: 10.1073/pnas.2317921121. Epub 2024 Oct 14. Proc Natl Acad Sci U S A. 2024. PMID: 39401360 Free PMC article.
References
-
- Albano E. Alcohol, oxidative stress and free radical damage. Proc Nutr Soc 65: 278– 290, 2006 - PubMed
-
- Albano E. Oxidative mechanisms in the pathogenesis of alcoholic liver disease. Mol Aspects Med 29: 9– 16, 2008 - PubMed
-
- Carlson TJ, Billings RE. Role of nitric oxide in the cytokine-mediated regulation of cytochrome P-450. Mol Pharmacol 49: 796– 801, 1996 - PubMed
-
- Cederbaum AI, Wu D, Mari M, Bai J. CYP2E1-dependent toxicity and oxidative stress in HepG2 cells. Free Radic Biol Med 31: 1539– 1543, 2001 - PubMed
-
- Choi DW, Kim SY, Kim SK, Kim YC. Factors involved in hepatic glutathione depletion induced by acute ethanol administration. J Toxicol Environ Health A 60: 459– 469, 2000 - PubMed
Publication types
MeSH terms
Substances
Grants and funding
LinkOut - more resources
Full Text Sources
Medical