. 2010 Sep;299(3):G652-60.
doi: 10.1152/ajpgi.00221.2010. Epub 2010 Jul 1.

Intestinal adaptation after ileal interposition surgery increases bile acid recycling and protects against obesity-related comorbidities

Affiliations

Intestinal adaptation after ileal interposition surgery increases bile acid recycling and protects against obesity-related comorbidities

Rohit Kohli et al. Am J Physiol Gastrointest Liver Physiol. 2010 Sep.

Abstract

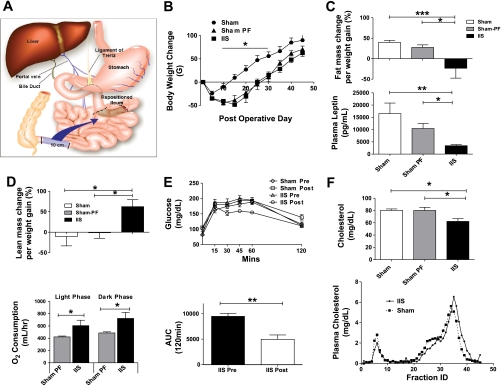
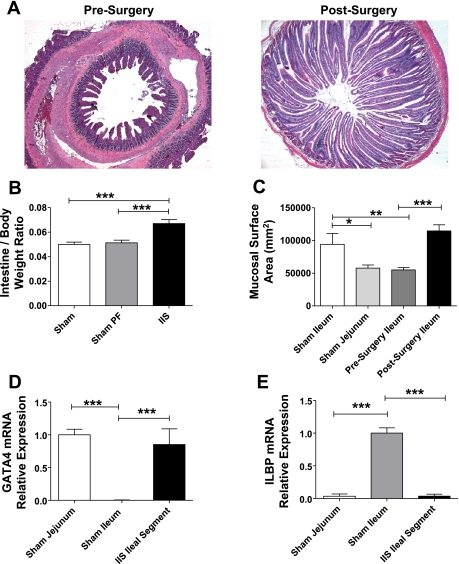
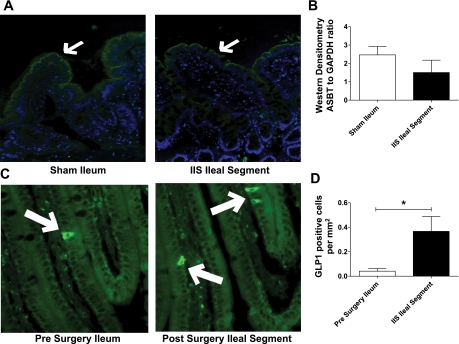
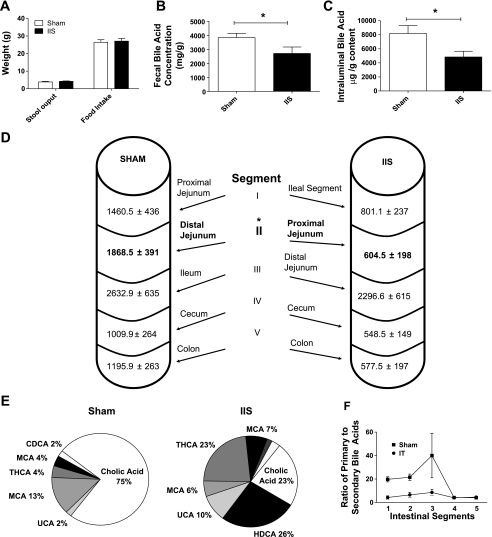
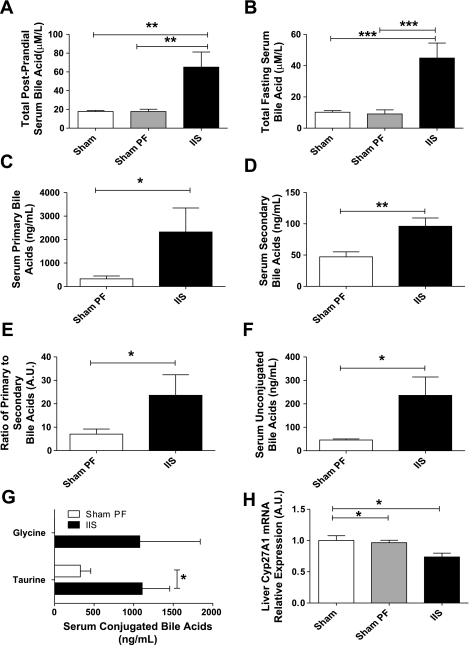
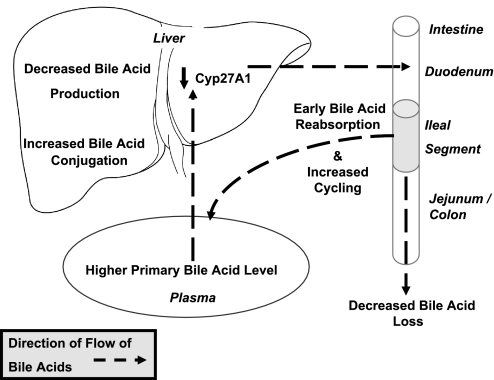
Surgical interposition of distal ileum into the proximal jejunum is a bariatric procedure that improves the metabolic syndrome. Changes in intestinal and hepatic physiology after ileal interposition (transposition) surgery (IIS) are not well understood. Our aim was to elucidate the adaptation of the interposed ileum, which we hypothesized, would lead to early bile acid reabsorption in the interposed ileum, thus short circuiting enterohepatic bile acid recycling to more proximal bowel segments. Rats with diet-induced obesity were randomized to IIS, with 10 cm of ileum repositioned distal to the duodenum, or sham surgery. A subgroup of sham rats was pair-fed to IIS rats. Physiological parameters were measured until 6 wk postsurgery. IIS rats ate less and lost more weight for the first 2 wk postsurgery. At study completion, body weights were not different, but IIS rats had reversed components of the metabolic syndrome. The interposed ileal segment adapted to a more jejunum-like villi length, mucosal surface area, and GATA4/ILBP mRNA. The interposed segment retained capacity for bile acid reabsorption and anorectic hormone secretion with the presence of ASBT and glucagon-like-peptide-1-positive cells in the villi. IIS rats had reduced primary bile acid levels in the proximal intestinal tract and higher primary bile acid levels in the serum, suggesting an early and efficient reabsorption of primary bile acids. IIS rats also had increased taurine and glycine-conjugated serum bile acids and reduced fecal bile acid loss. There was decreased hepatic Cyp27A1 mRNA with no changes in hepatic FXR, SHP, or NTCP expression. IIS protects against the metabolic syndrome through short-circuiting enterohepatic bile acid recycling. There is early reabsorption of primary bile acids despite selective "jejunization" of the interposed ileal segment. Changes in serum bile acids or bile acid enterohepatic recycling may mediate the metabolic benefits seen after bariatric surgery.


Figures

Fig. 1.
Fig. 1.
A: illustration depicting ileal interposition surgery. 10 cm of distal small intestine, starting 1 cm proximal to the ileo-cecal junction, is repositioned to the proximal jejunum. This is done by interpositioning the transected segment just beyond the ligament of Treitz. The segment is moved intact with all neurovascular connections and repositioned in a properistaltic direction. B: body weight change post surgery. Rats in the ileal interposition (IIS) surgery group lost more body weight compared with rats in the sham (SH) surgery group. There was a decrease in food intake in the IIS group. For groups IIS, SH, and SH-PF (sham surgery with pair-feeding to an IIS counterpart), n = 6, 7, 8, respectively (*P < 0.05). C: body fat mass change and plasma leptin levels. Magnetic resonance body composition analysis was performed on all rats prior to surgery and then subsequently a second time prior to death during the 5th wk after surgery. The weight gained by the SH and SH-PF groups had an increase in their proportion of fat tissue mass while IIS surgery group less fat mass as a percentage of new body weight gained compared with baseline. Plasma leptin levels were measured at completion of study. For groups IIS, SH, and SH-PF, n = 6, 7, or 8. (*P < 0.05; **P < 0.01; ***P < 0.001). D: body lean mass change and oxygen consumption. The weight gained by the SH and SH-PF groups had no change in their proportion of lean tissue mass, while the IIS surgery group had more lean mass as a percentage of new body weight gained compared with baseline. For groups IT, SH, and SH-PF, n = 6, 7, and 8, respectively. (*P < 0.05). Energy expenditure studies were conducted in the 5th wk after surgery. Oxygen consumption was higher in IIS rats compared with weight-matched SH-PF rats when observed in metabolic cages and given ad libitum access to a high-fat diet for 3 days (*P < 0.05; n = 7 per group). E: glucose tolerance after ileal interposition. Oral glucose tolerance tests were conducted prior to surgery (presurgery) and during the 5th wk after surgery (postsurgery). Rats in the IIS group had an improvement in their glucose tolerance with area under the curve (AUC) for 120 min being significantly less (**P < 0.01). F: plasma cholesterol levels and Fast-performance liquid chromatography (FPLC) fractions after ileal interposition. IIS rats lower plasma cholesterol levels compared with both SH and SH-PF controls. This was also a 25% reduction from presurgery circulating plasma cholesterol levels in the IIS group. For groups IIS, SH, and SH-PF, n = 7, 8, and 8, respectively. (*P < 0.05). Qualitative FPLC fraction analysis of plasma cholesterol lipoproteins heavier HDL particles were observed more in the IIS postsurgery rats (pooled plasma from n = 7 per group).
Fig. 2.
Fig. 2.
A: histological adaptation of the interposed segment. Photomicrographs (×10 magnification) of hematoxylin-and-eosin-stained sections of the same segment of ileum first at the time of surgery and then at the time of death 6 wk later. There is marked increase in the length and number of villi in the IIS rats. B: intestine-to-body weight ratios. Intestine weight normalized for body weight of the rat in IIS rats postsurgery was increased in IIS rats. For groups IIS, SH, and SH-PF, n = 6, 7, and 8, respectively (***P < 0.001). C: surface area of jejunum and ileum at surgery and study completion. Surface area of intestinal segments was estimated by using a formula of a cylinder and the ileal segment adapted to its new proximal environment to increase its surface area within 6 wk to jejunal levels. For groups IIS, SH, and SH-PF, n = 6, 7, and 8, respectively (*P < 0.05; **P < 0.01; ***P < 0.001). D: adaptation of epithelial jejunal specific gene GATA4 mRNA levels of proximal intestinal marker GATA4 were measured by RT-PCR and expressed in relative expression units to GAPDH (***P < 0.001). For groups IIS and SH, n =7 and 8, respectively. E: adaptation of epithelial ileal specific gene ILBP. mRNA levels of distal intestinal marker ILBP were measured by RT-PCR and expressed in relative expression units to GAPDH. (***P < 0.001). For groups IIS and SH, n = 7 and 8, respectively.
Fig. 3.
Fig. 3.
A: protein estimation for apical sodium bile acid transporter (ASBT) in ileal segment by immunohistochemistry (IHC). SH ileum and IIS ileal segment protein extracts probed for ASBT by IHC. Representative photomicrograph sections are shown with white arrows at ASBT fluorescence. B: protein estimation for ASBT in ileal segment by Western blot analysis. Quantification of Western blots was done by densitometry ratios of ASBT to GAPDH (for groups IIS and SH, n = 7 and 8, respectively). C: glucagon-like-peptide-1 (GLP-1) staining in ileum and ileal segment at study completion. Photomicrographs (×20 magnification) of histological sections stained for enteroendocrine cell marker GLP1 (positive cells stain green by fluorescent IHC). More positive stained cells can be seen in the transposed segment after surgery. D: quantification of GLP-1-positive cells per surface area. Positive cells quantified by single unbiased observer. For group IT, SH, and SH-PF, n = 6, 7, and 8, respectively (*P < 0.05).
Fig. 4.
Fig. 4.
A: stool output and food intake prior to study completion. In the week prior to study completion, stool output and food intake data were collected for 48 h. Average food intake and stool output per rat are plotted. For groups IIS and SH, n = 6 and 8, respectively. B: fecal bile acid concentration. Fecal bile acid concentration was measured by LC-MS technology in collected pellets described in A. There was reduced fecal bile acid concentration in the IIS group of rats. For groups IIS and SH, n = 7 and 7, respectively. (*P < 0.05). C: total intraluminal bile acid content. Bile acid content in intraluminal content was quantified using GC-MS and found to be reduced overall in the IIS rats postsurgery. D: segmental intraluminal bile acid content. Intraluminal chymal contents were further divided into five segments as detailed in the diagram and were lower in the segment just following the IIS interposed ileal segment (segment II) compared with corresponding SH segment (highlighted in bold). For groups IIS and SH, n = 6 and 7, respectively (P < 0.05). E: compositional analysis of intraluminal content. Pie chart of bile acid composition analysis for Segment I in SH and IIS rats. Percentage for cholic acid (CA), ursocholic acid (UCA), β murocholic acid (β MCA), tetrahydroxy hyocholic acid (THCA), and muricholic acid (MCA) are shown. For groups IIS and SH, n = 6 and 7, respectively (*P < 0.05). F: primary-to-secondary bile acid ratio. Primary bile acid [cholic acid (CA), chenodeoxycholic acid (CDCA), and β-muricholic acid (β MCA)] to secondary bile acid ratio was calculated for all five intraluminal intestinal segments. There was reduced ratio seen in IIS rats for Segments I and II with similar ratios seen in segments IV and V. For groups IIS and SH, n = 6 and 7, respectively.
Fig. 5.
Fig. 5.
A: serum postprandial bile acid level. Serum was collected after an overnight fast and 45 min after a fixed meal for postprandial total serum bile acid levels. These were significantly higher in rats that were in the IIS group compared with SH or SH-PF groups. For groups IIS, SH, and SH-PF; n = 6, 7, and 8, respectively (**P < 0.01). B: serum fasting bile acid level. Fasting serum bile acid levels were significantly higher in rats that were in the IIS group compared with SH or SH-PF groups. For groups IIS and SH-PF, n = 6 and 8, respectively (**P < 0.01). C: serum primary bile acid level. Postprandial serum primary bile acid levels by LC-MS were significantly higher in rats that were in the IIS group compared with SH-PF group. For groups IIS and SH-PF, n =6 and 8, respectively (*P < 0.05). D: serum secondary bile acid level. Postprandial serum secondary bile acid levels by LC-MS were significantly higher in rats that were in the IIS group compared with SH-PF group. For groups IIS and SH-PF, n = 6 and 8, respectively. (**P < 0.01). E: serum primary to secondary bile acid ratio. Primary bile acid CA, CDCA, and β MCA to secondary bile acid ratio by LC-MS was reduced in IIS rats. For groups IIS and SH-PF, n = 6 and 8, respectively (*P < 0.05). F: serum unconjugated bile acid level. Postprandial serum unconjugated bile acid levels by LC-MS were significantly higher in rats that were in the IIS group compared with SH-PF group. For IIS and SH-PF groups, n = 6 and 8, respectively. (*P < 0.05). G: serum conjugated bile acids level. Postprandial serum-conjugated bile acid (taurine and glycine conjugated) levels by LC-MS were significantly higher in rats that were in the IIS group compared with SH-PF group. There were no glycine-conjugated bile acids measured in the SH-PF group. For groups IIS and SH-PF, n = 6 and 8, respectively (*P < 0.05). H: liver mRNA levels of bile acid production regulating enzymes. The mRNA expression of Cyp7A1 was not different between groups but Cyp27A1 that regulates the alternate pathway of bile acid production was suppressed in the IIS rats compared with the SH and SH-PF rats. For groups IIS, SH, and SH-PF, n = 7, 8, and 8, respectively. (*P < 0.05).
Fig. 6.
Fig. 6.
Schematic of bile acid and cholesterol physiology in IIS rats.

Similar articles

Cited by

References

    1. Baker RD, Searle GW. Bile salt absorption at various levels of rat small intenstine. Proc Soc Exp Biol Med 105: 521–523, 1960 - PubMed
    1. Baxter JD, Webb P. Metabolism: bile acids heat things up. Nature 439: 402–403, 2006 - PubMed
    1. Boza C, Gagner M, Devaud N, Escalona A, Munoz R, Gandarillas M. Laparoscopic sleeve gastrectomy with ileal transposition (SGIT): A new surgical procedure as effective as gastric bypass for weight control in a porcine model. Surg Endosc 22: 1029–1034, 2008 - PubMed
    1. Buchwald H, Avidor Y, Braunwald E, Jensen MD, Pories W, Fahrbach K, Schoelles K. Bariatric surgery: a systematic review and meta-analysis. JAMA 292: 1724–1737, 2004 - PubMed
    1. Cummings BP, Strader AD, Stanhope KL, Graham JL, Lee J, Raybould HE, Baskin DG, Havel PJ. Ileal Interposition Surgery Improves Glucose and Lipid Metabolism and Delays Diabetes Onset in the UCD-T2DM Rat. Gastroenterology 138: 2437–2446, 2010 - PMC - PubMed

Publication types