. 2010 Sep;12(5):687-96.
doi: 10.2353/jmoldx.2010.090187. Epub 2010 Jul 1.

Accurate molecular classification of renal tumors using microRNA expression

Affiliations

Accurate molecular classification of renal tumors using microRNA expression

Eddie Fridman et al. J Mol Diagn. 2010 Sep.

Abstract

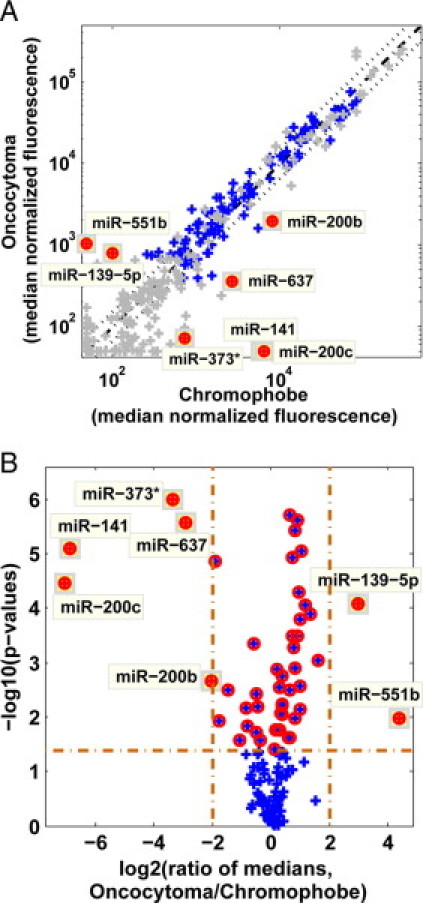
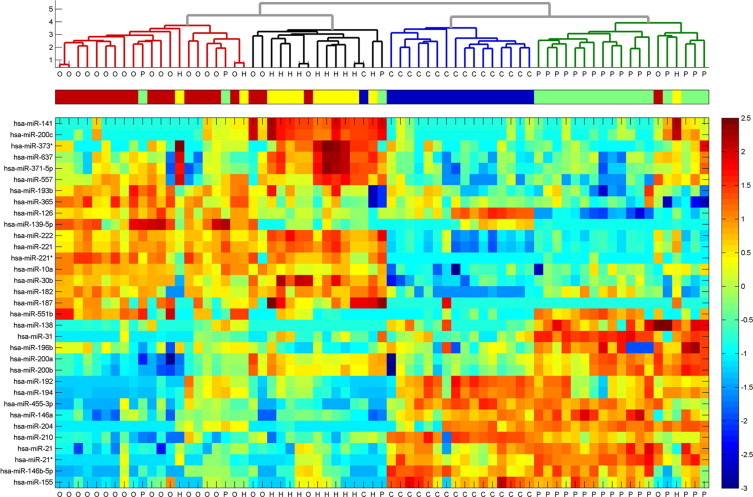
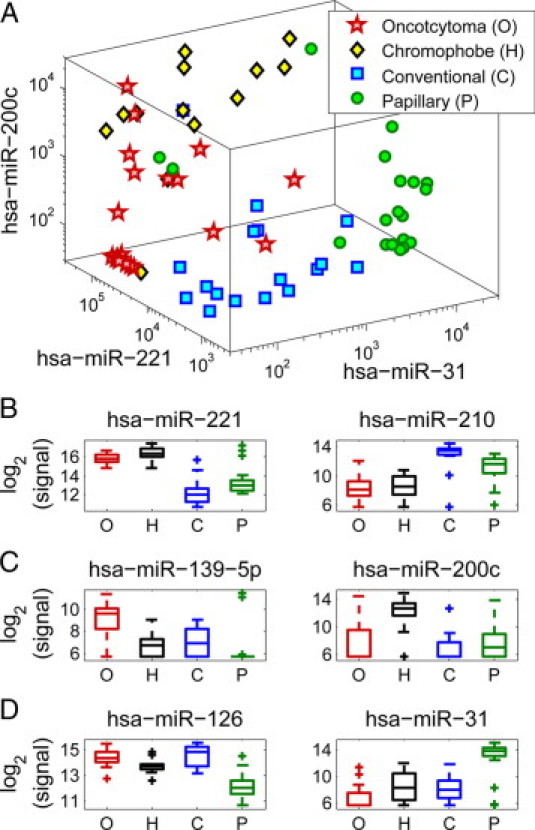
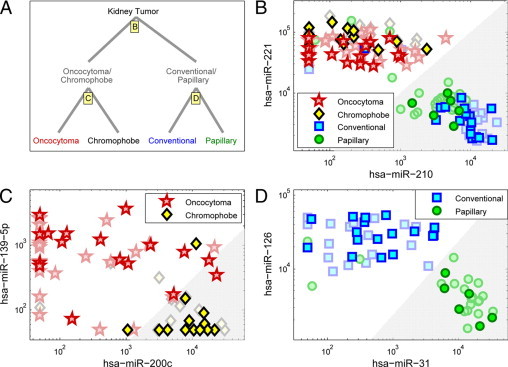
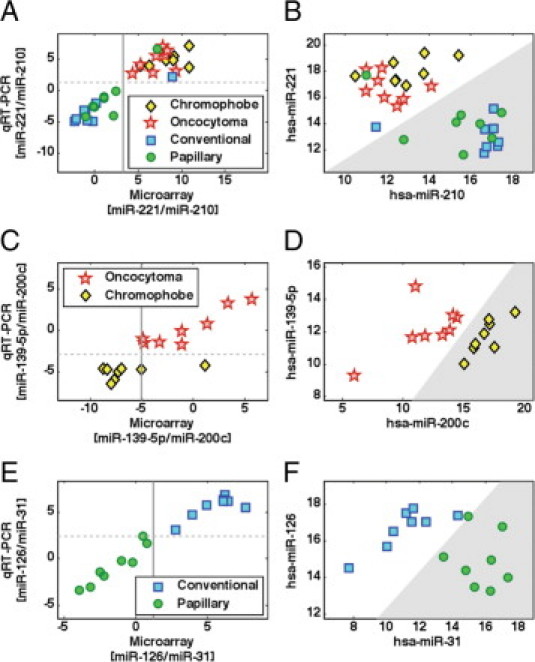
Subtypes of renal tumors have different genetic backgrounds, prognoses, and responses to surgical and medical treatment, and their differential diagnosis is a frequent challenge for pathologists. New biomarkers can help improve the diagnosis and hence the management of renal cancer patients. We extracted RNA from 71 formalin-fixed paraffin-embedded (FFPE) renal tumor samples and measured expression of more than 900 microRNAs using custom microarrays. Clustering revealed similarity in microRNA expression between oncocytoma and chromophobe subtypes as well as between conventional (clear-cell) and papillary tumors. By basing a classification algorithm on this structure, we followed inherent biological correlations and could achieve accurate classification using few microRNAs markers. We defined a two-step decision-tree classifier that uses expression levels of six microRNAs: the first step uses expression levels of hsa-miR-210 and hsa-miR-221 to distinguish between the two pairs of subtypes; the second step uses either hsa-miR-200c with hsa-miR-139-5p to identify oncocytoma from chromophobe, or hsa-miR-31 with hsa-miR-126 to identify conventional from papillary tumors. The classifier was tested on an independent set of FFPE tumor samples from 54 additional patients, and identified correctly 93% of the cases. Validation on qRT-PCR platform demonstrated high correlation with microarray results and accurate classification. MicroRNA expression profiling is a very effective molecular bioassay for classification of renal tumors and can offer a quantitative standardized complement to current methods of tumor classification.


Figures

Figure 1
Figure 1
Graphic representations of differentially expressed microRNAs. A: Scatter-plot and volcano-plot comparison of oncocytoma and chromophobe samples from the training set. Median normalized fluorescence of oncocytoma samples (n = 21) is plotted against the median normalized fluorescence of chromophobe samples (n = 13). Each microRNA is represented by a blue cross. Control probes and microRNAs that did not pass the minimum expression threshold of median normalized fluorescence >700 (in at least one of the two groups) are shown in gray. Diagonal line shows equal signals (dash-dot line) and twofold change in either direction (dotted lines). MicroRNAs that had a fold change >4 in either direction and had a P value lower than 0.0417 (the threshold determined for a false discovery rate of 0.1 or lower) are shown as full red circles. B: Volcano plot showing the –log10(P value) against the log2 of the ratio of the median expression for the same data. MicroRNAs with strong fold changes have a large absolute value of the log2(ratio). Vertical lines indicate fourfold change in median signal in either direction; horizontal line indicates the P value cut-off of 0.0417. Red circles show p-value <0.0417; full circles as in panel A.
Figure 2
Figure 2
Clustering of kidney tumors by microRNA expression. The 33 differentially-expressed microRNAs (Table 1) were used to cluster the 71 samples of the training set. Normalized fluorescence signals were log-transformed, shifted to mean = 0, and rescaled to STD = 1 to enhance the expression differences. Outlying values were trimmed for optimal scaling (lower panel). The Euclidian distance was calculated between every pair of samples, and a hierarchical binary cluster tree was generated from these distances using the inner squared distance algorithm, and taking the logarithm of the resulting distances. The upper panel shows a dendrogram of hierarchical clustering of these samples. The histological type of each sample is indicated in the middle panel, with oncocytoma samples (“O,” n = 21) indicated in red, chromophobe tumors (“H,” n = 13) shown in yellow, conventional tumors (“C,” n = 17) shown in blue, and papillary tumors (“P,” n = 20) in green. The samples clustered into four groups that closely follow the four histological types. Among the four groups, the oncocytoma and chromophobe samples cluster together, whereas the conventional tumors show a higher degree of similarity to papillary tumors.
Figure 3
Figure 3
Separation between histological types using a small set of microRNAs. The training set included oncocytoma samples (“O,” n = 21, red stars), chromophobe tumors (“H,” n = 13, black/yellow diamonds), conventional tumors (“C,” n = 17, blue squares), and papillary tumors (“P,” n = 20, green circles). Plotting the expression of hsa-miR-221, hsa-miR-31, and hsa-miR-200c in each of the training set samples (A), the four types of samples group into areas with distinct ranges of expression. Box-plots (B, C, and D) indicate expression levels of microRNAs in the four histological types (same samples as in A), showing the median value (horizontal line), 25 to 75 percentile (box), extent of data (whiskers), and outliers (crosses). Hsa-miR-221 and hsa-miR-210 (B) have distinct expression in oncocytomas and chromophobe tumors compared with conventional and papillary tumor, with hsa-miR-221 more strongly expressed in oncocytomas and chromophobe tumors, and hsa-miR-210 more strongly expressed in conventional and papillary tumors. Hsa-miR-139-5p and hsa-miR-200c (C) have distinct expression in oncocytomas compared with chromophobe tumors, with hsa-miR-139-5p more strongly expressed in oncocytomas and hsa-miR-200c more strongly expressed in chromophobe tumors. Hsa-miR-126 and hsa-miR-31 (D) have distinct expression in conventional tumors compared with papillary tumors, with hsa-miR-126 more strongly expressed in conventional tumors and hsa-miR-31 more strongly expressed in papillary tumors.
Figure 4
Figure 4
Classification of kidney tumors using expression levels of six microRNAs (microarray data). A: Classification proceeds in two steps, following the cluster structure of the histological types (Figure 2). First, samples are classified into either the oncocytoma/chromophobe pair, or the conventional/papillary pair, using expression levels of hsa-miR-210 and hsa-miR-221 (B). In the second step, oncocytoma is differentiated from chromophobe using expression levels of hsa-miR-200c and hsa-miR-139-5p (C), and conventional is differentiated from papillary using expression levels of hsa-miR-31 and hsa-miR-126 (D). Independent test samples included oncocytoma samples (n = 19, red stars), chromophobe tumors (n = 14, black/yellow diamonds), conventional tumors (n = 17, blue squares), and papillary tumors (n = 6, green circles). The gray shaded regions indicate the thresholds for classification for each pair of microRNAs, indicating in each case the right branch in the binary classification tree (A). The 71 samples that were used for training the thresholds (see Methods and Figure 3) are shown in faded symbols in the background.
Figure 5
Figure 5
Validation by qRT-PCR. The qRT-PCR validation set included 32 tumor samples: 8 oncocytoma tumors (red stars), 8 chromophobe tumors (yellow diamonds), 8 conventional tumors (blue squares), and 8 papillary tumors (green circles). For each decision point (Figure 4A), the plot on the left side (A, C, or E) shows the log2 expression ratio of the two microRNAs used at this node as measured by microarray (horizontal, calculated as the log2 ratio of the normalized fluorescence signal) and by qRT-PCR (vertical, calculated as the difference in normalized Ct values). In each plot, the vertical line demarcates the classification threshold trained on the microarray data, while the horizontal line indicates the classification threshold that was chosen for the qRT-PCR data, based on the microarray threshold (Methods). The plots on the right side (B, D, or F) show the qRT-PCR data (normalized Cts) of the two microRNAs in the samples of the relevant subtypes at each node. The gray shaded regions indicate the thresholds for classification for each pair of microRNAs, indicating in each case the right branch in the binary classification tree (Figure 4A). A: Log2 expression ratio of [hsa-miR-221/hsa-miR-210] in microarray and qRT-PCR. Correlation coefficient was 0.92. B: Normalized Cts of hsa-miR-221 and hsa-miR-210 in 32 samples. C: Log2 expression ratio of [hsa-miR-139-5p/hsa-miR-200c] in microarray and qRT-PCR. Correlation coefficient was 0.86. D: Normalized Cts of hsa-miR-139-5p and hsa-miR-200c in 16 oncocytoma and chromophobe samples. E: Log2 expression ratio of [hsa-miR-126/hsa-miR-31] in microarray and qRT-PCR. Correlation coefficient was 0.98. F: Normalized Cts of hsa-miR-126 and hsa-miR-31 in 16 conventional and papillary samples.

References

    1. Jemal A, Siegel R, Ward E, Hao Y, Xu J, Murray T, Thun MJ. Cancer statistics, 2008. CA Cancer J Clin. 2008;58:71–96. - PubMed
    1. Hollingsworth JM, Miller DC, Daignault S, Hollenbeck BK. Rising incidence of small renal masses: a need to reassess treatment effect. J Natl Cancer Inst. 2006;98:1331–1334. - PubMed
    1. Jemal A, Siegel R, Ward E, Murray T, Xu J, Smigal C, Thun MJ. Cancer statistics, 2006. CA Cancer J Clin. 2006;56:106–130. - PubMed
    1. Chow WH, Devesa SS, Warren JL, Fraumeni JF., Jr Rising incidence of renal cell cancer in the United States. JAMA. 1999;281:1628–1631. - PubMed
    1. Chow WH, Linehan WM, Devesa SS. Re: Rising incidence of small renal masses: a need to reassess treatment effect. J Natl Cancer Inst 99: 569–570, author reply 2007, 570–561 - PubMed

Publication types

MeSH terms