

Identification of a structural motif in the tumor-suppressive protein GRIM-19 required for its antitumor activity
- PMID: 20595633
- PMCID: PMC2913340
- DOI: 10.2353/ajpath.2010.091280
Identification of a structural motif in the tumor-suppressive protein GRIM-19 required for its antitumor activity
Erratum in
- Am J Pathol. 2014 Mar;184(3):878
Abstract
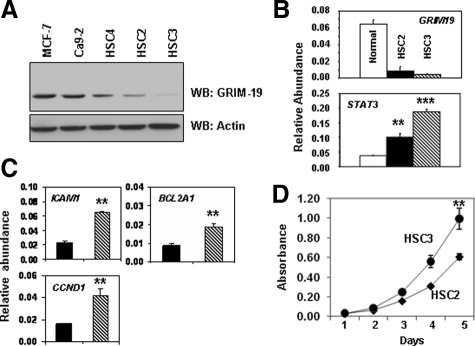
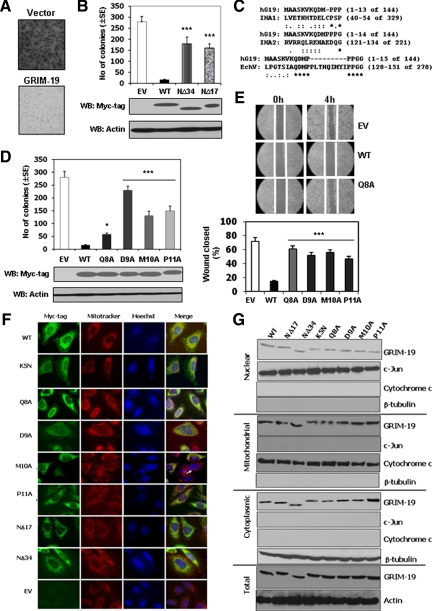
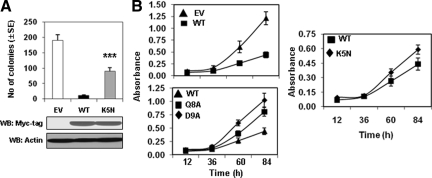
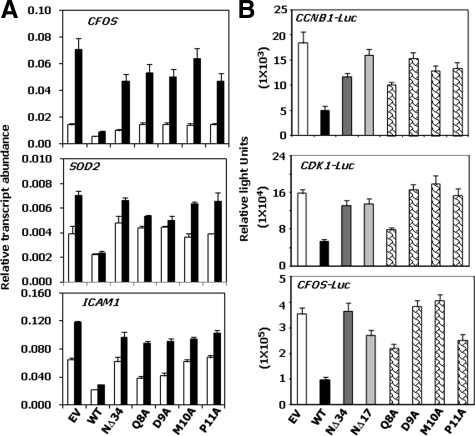
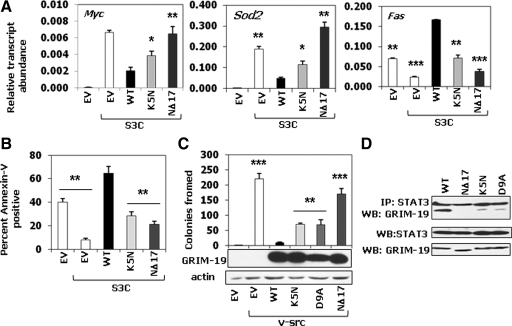
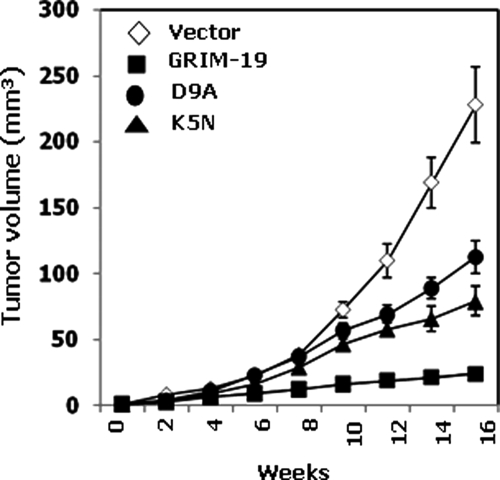
We have previously isolated GRIM-19, a novel growth suppressor, using a genetic method. GRIM-19 ablates cell growth by inhibiting the transcription factor signal transducer and activator of transcription 3 (STAT3). Up-regulation of STAT3 and growth promotion were observed in a number of human tumors. Although the tumor-suppressive actions of GRIM-19 are known, the structural elements required for its antitumor actions are not understood. Mutational and protein sequence analyses identified a motif in the N terminus of GRIM-19 that exhibited similarity to certain RNA viral proteins. We show that disruption of specific amino acids within this motif cripples the antitumor actions of GRIM-19. These mutants fail to interact with STAT3 efficiently and consequently do not inhibit growth-promoting gene expression. More importantly, we show that a clinically observed mutation in the N terminus of GRIM-19 also weakened its interaction with STAT3 and antitumor action. Together, these studies identify a major role for the N terminus of GRIM-19 in mediating its tumor-suppressive actions.
Figures
Similar articles
-
GRIM-19: A master regulator of cytokine induced tumor suppression, metastasis and energy metabolism.Cytokine Growth Factor Rev. 2017 Feb;33:1-18. doi: 10.1016/j.cytogfr.2016.09.001. Epub 2016 Sep 15. Cytokine Growth Factor Rev. 2017. PMID: 27659873 Free PMC article. Review.
-
Tumor suppressive protein gene associated with retinoid-interferon-induced mortality (GRIM)-19 inhibits src-induced oncogenic transformation at multiple levels.Am J Pathol. 2007 Oct;171(4):1352-68. doi: 10.2353/ajpath.2007.070241. Epub 2007 Sep 6. Am J Pathol. 2007. PMID: 17823279 Free PMC article.
-
Down-regulation of GRIM-19 expression is associated with hyperactivation of STAT3-induced gene expression and tumor growth in human cervical cancers.J Interferon Cytokine Res. 2009 Oct;29(10):695-703. doi: 10.1089/jir.2009.0003. J Interferon Cytokine Res. 2009. PMID: 19642906 Free PMC article.
-
Plasmid-based Stat3-specific siRNA and GRIM-19 inhibit the growth of thyroid cancer cells in vitro and in vivo.Oncol Rep. 2014 Aug;32(2):573-80. doi: 10.3892/or.2014.3233. Epub 2014 Jun 5. Oncol Rep. 2014. PMID: 24899100
-
GRIM-19 function in cancer development.Mitochondrion. 2011 Sep;11(5):693-9. doi: 10.1016/j.mito.2011.05.011. Epub 2011 Jun 2. Mitochondrion. 2011. PMID: 21664299 Review.
Cited by
-
Heterogeneity of GRIM-19 Expression in the Adult Mouse Brain.Cell Mol Neurobiol. 2019 Oct;39(7):935-951. doi: 10.1007/s10571-019-00689-1. Epub 2019 May 21. Cell Mol Neurobiol. 2019. PMID: 31111264 Free PMC article.
-
GRIM-19-mediated translocation of STAT3 to mitochondria is necessary for TNF-induced necroptosis.J Cell Sci. 2012 Jun 15;125(Pt 12):2995-3003. doi: 10.1242/jcs.103093. Epub 2012 Mar 5. J Cell Sci. 2012. Retraction in: J Cell Sci. 2016 Jul 1;129(13):2686. doi: 10.1242/jcs.193615. PMID: 22393233 Free PMC article. Retracted.
-
CIGB-300-Regulated Proteome Reveals Common and Tailored Response Patterns of AML Cells to CK2 Inhibition.Front Mol Biosci. 2022 Mar 11;9:834814. doi: 10.3389/fmolb.2022.834814. eCollection 2022. Front Mol Biosci. 2022. PMID: 35359604 Free PMC article.
-
GRIM-19: A master regulator of cytokine induced tumor suppression, metastasis and energy metabolism.Cytokine Growth Factor Rev. 2017 Feb;33:1-18. doi: 10.1016/j.cytogfr.2016.09.001. Epub 2016 Sep 15. Cytokine Growth Factor Rev. 2017. PMID: 27659873 Free PMC article. Review.
-
Tumor-derived mutations in the gene associated with retinoid interferon-induced mortality (GRIM-19) disrupt its anti-signal transducer and activator of transcription 3 (STAT3) activity and promote oncogenesis.J Biol Chem. 2013 Mar 15;288(11):7930-7941. doi: 10.1074/jbc.M112.440610. Epub 2013 Feb 5. J Biol Chem. 2013. PMID: 23386605 Free PMC article.
References
-
- Schindler C, Levy DE, Decker T. JAK-STAT signaling: from interferons to cytokines. J Biol Chem. 2007;282:20059–20063. - PubMed
-
- Kalvakolanu DV. The GRIMs: a new interface between cell death regulation and interferon/retinoid induced growth suppression. Cytokine Growth Factor Rev. 2004;15:169–194. - PubMed
-
- Kimchi A. DAP genes: novel apoptotic genes isolated by a functional approach to gene cloning. Biochim Biophys Acta. 1998;1377:F13–F33. - PubMed
-
- Angell JE, Lindner DJ, Shapiro PS, Hofmann ER, Kalvakolanu DV. Identification of GRIM-19, a novel cell death-regulatory gene induced by the interferon-β and retinoic acid combination, using a genetic approach. J Biol Chem. 2000;275:33416–33426. - PubMed
-
- Fearnley IM, Carroll J, Shannon RJ, Runswick MJ, Walker JE, Hirst J. GRIM-19, a cell death regulatory gene product, is a subunit of bovine mitochondrial NADH: ubiquinone oxidoreductase (complex I). J Biol Chem. 2001;276:38345–38348. - PubMed
Publication types
MeSH terms
Substances
Grants and funding
LinkOut - more resources
Full Text Sources
Other Literature Sources
Miscellaneous
