. 2010 Sep;21(9):1477-87.
doi: 10.1681/ASN.2009121244. Epub 2010 Jul 1.

Smad2 protects against TGF-beta/Smad3-mediated renal fibrosis

Affiliations

Smad2 protects against TGF-beta/Smad3-mediated renal fibrosis

Xiao Ming Meng et al. J Am Soc Nephrol. 2010 Sep.

Abstract

Smad2 and Smad3 interact and mediate TGF-beta signaling. Although Smad3 promotes fibrosis, the role of Smad2 in fibrogenesis is largely unknown. In this study, conditional deletion of Smad2 from the kidney tubular epithelial cells markedly enhanced fibrosis in response to unilateral ureteral obstruction. In vitro, Smad2 knockdown in tubular epithelial cells increased expression of collagen I, collagen III, and TIMP-1 and decreased expression of the matrix-degrading enzyme MMP-2 in response to TGF-beta1 compared with similarly treated wild-type cells. We obtained similar results in Smad2-knockout fibroblasts. Mechanistically, Smad2 deletion promoted fibrosis through enhanced TGF-beta/Smad3 signaling, evidenced by greater Smad3 phosphorylation, nuclear translocation, promoter activity, and binding of Smad3 to a collagen promoter (COL1A2). Moreover, deletion of Smad2 increased autoinduction of TGF-beta1. Conversely, overexpression of Smad2 attenuated TGF-beta1-induced Smad3 phosphorylation and collagen I matrix expression in tubular epithelial cells. In conclusion, in contrast to Smad3, Smad2 protects against TGF-beta-mediated fibrosis by counteracting TGF-beta/Smad3 signaling.


Figures

Figure 1.
Figure 1.
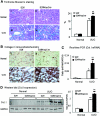
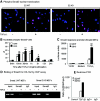
Characterization of conditional Smad2 KO mice, Smad2 KO MEFs, and Smad2 knockdown TECs. (A) PCR detects that the Cre recombination (235 bp) results in the Smad2 floxed gene (451 bp) being deleted from the kidney (592 bp) in the conditional Smad2 KO mice (Smad2ff/KspCre). (B and C) Real-time PCR and Western blot analysis show a substantial deletion of Smad2 mRNA and protein from the kidney in S2ff/CreKsp mice under normal and diseased conditions. (D) Immunohistochemistry reveals that Smad2 (brown) is highly expressed by all kidney cell types in Smad2ff mice but is specifically deleted from most of kidney TECs. Note that expression of Smad2 in glomeruli (g) and vascular cells remains high in a Smad2ff/KspCre mouse. (E) Western blot analysis shows a deletion of Smad2 expression in Smad2 KO MEFs. (F) Western blot analysis shows a Smad2 being knocked down from TECs (NRK52E). Results represent groups of eight mice (A through D). Real-time PCR data are expressed as means ± SEM for groups of eight mice. ***P < 0.001 versus normal; ###P < 0.001 versus diseased Smad2ff (UUO) mice. Magnification, ×400 in D.
Figure 2.
Figure 2.
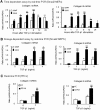
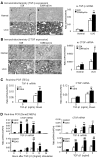
Disruption of Smad2 from the kidney promotes tubulointerstitial fibrosis and collagen I expression in a mouse model of UUO at day 10. (A) Masson's trichrome staining paraffin sections and quantitative analysis. Note that compared with the UUO kidney from a littermate Smad2 flox/flox mouse (S2ff), interstitial collagen matrix accumulation (green) is largely increased in the UUO kidney of conditional Smad2 KO mice (S2ff/KspCre). (B) Collagen I immunohistochemical staining. (C) Collagen I mRNA expression by real-time PCR analysis. (D) Collagen I expression by Western blot analysis. Each lane represents one mouse UUO kidney. Data are means ± SEM for groups of eight mice. *P < 0.05, ***P < 0.001 versus normal; ###P < 0.001 versus injured Smad2ff (UUO) mice. Magnifications: ×100 in A; ×200 in B.
Figure 3.
Figure 3.
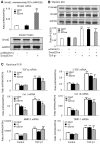
Disruption of Smad2 from the kidney promotes tubulointerstitial fibrosis as identified by collagen III expression in a mouse model of UUO at day 10. (A) Immunohistochemistry. (B) Real-time PCR. (C) Western blot. Data are means ± SEM for groups of eight mice. *P < 0.05, ***P < 0.001 versus normal; ###P < 0.001 versus injured Smad2ff (UUO) mice. S2ff, Smad2 flox/flox mouse; S2ff/KspCre, conditional Smad2 KO mice, Col., collagen. Magnification, ×200 in A.
Figure 4.
Figure 4.
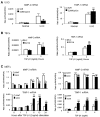
Real-time PCR reveals that disruption of Smad2 in MEFs or knockdown of Smad2 from TECs enhances TGF-β1–induced collagens I and III mRNA expression. (A) Deletion of Smad2 enhances collagen I and collagen III mRNA in a time-dependent manner in response to TGF-β1 (2 ng/ml). (B) Deletion of Smad2 enhances TGF-β1–induced (2 ng/ml) collagen I and collagen III mRNA at a peak time (3 hours) in a dosage-dependent manner. (C) Knockdown of Smad2 from TECs promotes collagen I and collagen III mRNA expression induced by TGF-β1 (2 ng/ml) at 3 hours. Data are means ± SEM for four independent experiments. *P < 0.05, **P < 0.01, ***P < 0.001 versus time or dosage 0; #P < 0.05, ##P < 0.01, ###P < 0.001 versus Smad2 WT MEFs (A and B) or Smad2 knockdown TECs (C). VC, empty vector control; S2Kd, Smad2 knockdown.
Figure 5.
Figure 5.
Western blot analysis shows that deletion of Smad2 in MEFs enhances TGF-β1–induced collagens I and III protein expression in a time- and dosage-dependent manner. (A) TGF-β1 (2 ng/ml) induces collagen I (Col. I) and collagen III (Col. III) protein expression in a time-dependent manner. (B) TGF-β1 induces collagen I (Col. I) and collagen III (Col. III) protein expression at 24 hours in a dosage-dependent manner. Data are means ± SEM for four independent experiments. *P < 0.05, **P < 0.01, ***P < 0.001 versus time or dosage 0; #P < 0.05, ##P < 0.01, ###P < 0.001 versus Smad2 WT MEFs.
Figure 6.
Figure 6.
Real-time PCR detects that disruption of Smad2 impairs collagen matrix degradation in a mouse model of UUO at day 10 and in vitro. (A) Real-time PCR shows that compared with the Smad2ff mice, conditional deletion of Smad2 from the kidney results in further inhibition of MMP-2 but significantly increases TIMP-1 expression. (B) In vitro, knockdown of Smad2 from TECs (NRK52E) results in a significant inhibition of TGF-β1–induced (2 ng/ml) MMP-2 while further increasing TIMP-1 mRNA expression at 3 hours after TGF-β1 stimulation. (C) Real-time PCR reveals that compared with the Smad2 WT MEFs, MEFs lacking Smad2 show a further suppression of MMP-2 while upregulating TIMP-1 mRNA expression in response to TGF-β1 in a time-dependent (3 hours) and a dosage-dependent (2 ng/ml) manner. Data are means ± SEM for four independent experiments in vitro and groups of eight mice in vivo. *P < 0.05, **P < 0.01, ***P < 0.001 versus time (dosage) 0 or normal; #P < 0.05, ##P < 0.01, ###P < 0.001 versus Smad2WT MEFs or injured Smad2ff (UUO) mice.
Figure 7.
Figure 7.
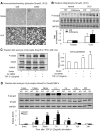
Deletion of Smad2 enhances Smad3 phosphorylation in the UUO kidney and in vitro in response to TGF-β1. (A and B) Immunohistochemistry and Western blot analysis show that compared with the UUO kidney of Smad2ff mice, numbers of nucleated phospho-Smad3–positive cells and phospho-Smad3 protein are markedly increased in the UUO kidney of conditional Smad2 KO mice. (C) Knockdown of Smad2 from TECs (NRK52E) results in a significant increase in phospho-Smad3 at 30 minutes (peak time) after TGF-β1 stimulation. (D) Western blot analysis shows that compared with Smad2 WT MEFs, addition of TGF-β1 (2 ng/ml) largely enhances Smad3 phosphorylation in Smad2 KO MEFs in a time-dependent manner when compared with the Smad2 WT MEFs. Data are means ± SEM for groups of eight mice in vivo and four independent experiments in vitro. *P < 0.05, **P < 0.01, ***P < 0.001 versus time (dosage) 0 or normal; #P < 0.05, ##P < 0.01, ###P < 0.001 versus Smad2WT MEFs or injured Smad2ff (UUO) mice.
Figure 8.
Figure 8.
Deletion of Smad2 enhances Smad3 signaling in MEFs. (A) Immunofluorescence detects that MEFs lacking Smad2 substantially enhance phosphorylated Smad3 nuclear translocation at 30 minutes after TGF-β1 (2 ng/ml) stimulation when compared with the Smad2 WT MEFs. (B) Quantitative analysis of phospho-Smad3 nuclear translocation in response to TGF-β1 (2 ng/ml). (C) Smad3 promoter activity assay. (D) ChIP assay for binding of Smad3 to the COL1A2 promoter. (E) Quantitative real-time PCR analysis of the binding of Smad3 to COL1A2. Data are means ± SEM for four independent experiments. *P < 0.05, **P < 0.01, ***P < 0.001 versus time 0 or empty vector control; #P < 0.05, ##P < 0.01, ###P < 0.001 versus Smad2 WT MEFs.
Figure 9.
Figure 9.
Disruption of Smad2 increases autoinduction of TGF-β1 and upregulation of CTGF in the diseased kidney after UUO at day 10 and in vitro. (A and B) Both immunohistochemistry and real-time PCR analyses show that compared with the UUO Smad2ff mice (iii and v), conditional Smad2 KO (Smad2ff/KspCre) significantly enhances TGF-β1 (A) and CTGF (B) expression (iv and v). (C) NRK52E TECs with Smad2 knockdown exhibit an enhancement of TGF-β1 and CTGF mRNA expression in response to TGF-β1(2 ng/ml) stimulation at 3 hours. (D) Deletion of Smad2 in MEFs enhances the mRNA levels of TGF-β1 and CTGF in response to TGF-β1 stimulation in a time-dependent (6 hours) and a dosage-dependent (2 ng/ml TGF-β1) manner. Data are means ± SEM for groups of eight mice in vivo (A and B) or for four independent experiments in vitro (C and D). *P < 0.05, **P < 0.01, ***P < 0.001 versus time (dosage) 0 or normal; #P < 0.05, ##P < 0.01, ###P < 0.001 versus Smad2 WT MEFs (A) or injured Smad2ff (UUO) mice. VC, empty vector control; S2Kd, Smad2 knockdown.
Figure 10.
Figure 10.
Overexpression of Smad2 attenuates the fibrotic effect of TGF-β1 in TECs. (A) Characterization of Smad2-overexpressing TECs. (B) Western blot analysis shows that compared with empty vector control (VC), overexpression of Smad2 (S2Over) inhibits TGF-β1–induced (2 ng/ml) phosphorylation of Smad3 in TECs (NRK52E). (C) Real-time PCR shows that overexpression of Smad2 in TECs attenuates the fibrosis response to TGF-β1 (2 ng/ml, 3 hours), including a significant inhibition of TGF-β1, CTGF, collagens I and III, and TIMP mRNA expression, while increasing MMP-2 expression. Data are means ± SEM for four independent experiments. *P < 0.05, **P < 0.01, ***P < 0.001 versus time 0 or empty vector control; #P < 0.05, ##P < 0.01, ###P < 0.001 versus empty vector control (VC).

Similar articles

Cited by

References

    1. Schnaper HW, Hayashida T, Poncelet AC: It's a Smad world: Regulation of TGF-beta signaling in the kidney. J Am Soc Nephrol 13: 1126–1128, 2002 - PubMed
    1. Liu Y: Renal fibrosis: New insights into the pathogenesis and therapeutics. Kidney Int 69: 213–217, 2006 - PubMed
    1. Bottinger EP, Bitzer M: TGF-beta signaling in renal disease. J Am Soc Nephrol 13: 2600–2610, 2002 - PubMed
    1. Wang W, Koka V, Lan HY: Transforming growth factor-beta and Smad signalling in kidney diseases. Nephrology (Carlton) 10: 48–56, 2005 - PubMed
    1. Derynck R, Zhang YE: Smad-dependent and Smad-independent pathways in TGF-beta family signalling. Nature 425: 577–584, 2003 - PubMed

Publication types