

Reduced hepatic synthesis of calcidiol in uremia
- PMID: 20595682
- PMCID: PMC3013518
- DOI: 10.1681/ASN.2009080815
Reduced hepatic synthesis of calcidiol in uremia
Abstract
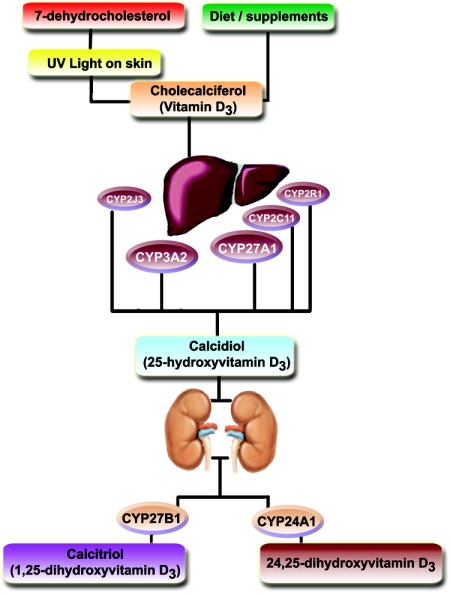
Calcidiol insufficiency is highly prevalent in chronic kidney disease (CKD), but the reasons for this are incompletely understood. CKD associates with a decrease in liver cytochrome P450 (CYP450) enzymes, and specific CYP450 isoforms mediate vitamin D(3) C-25-hydroxylation, which forms calcidiol. Abnormal levels of parathyroid hormone (PTH), which also modulates liver CYP450, could also contribute to the decrease in liver CYP450 associated with CKD. Here, we evaluated the effects of PTH and uremia on liver CYP450 isoforms involved in calcidiol synthesis in rats. Uremic rats had 52% lower concentrations of serum calcidiol than control rats (P < 0.002). Compared with controls, uremic rats produced 71% less calcidiol and 48% less calcitriol after the administration of vitamin D(3) or 1alpha-hydroxyvitamin D(3), respectively, suggesting impaired C-25-hydroxylation of vitamin D(3). Furthermore, uremia associated with a reduction of liver CYP2C11, 2J3, 3A2, and 27A1. Parathyroidectomy prevented the uremia-associated decreases in calcidiol and liver CYP450 isoforms. In conclusion, these data suggest that uremia decreases calcidiol synthesis secondary to a PTH-mediated reduction in liver CYP450 isoforms.
Figures
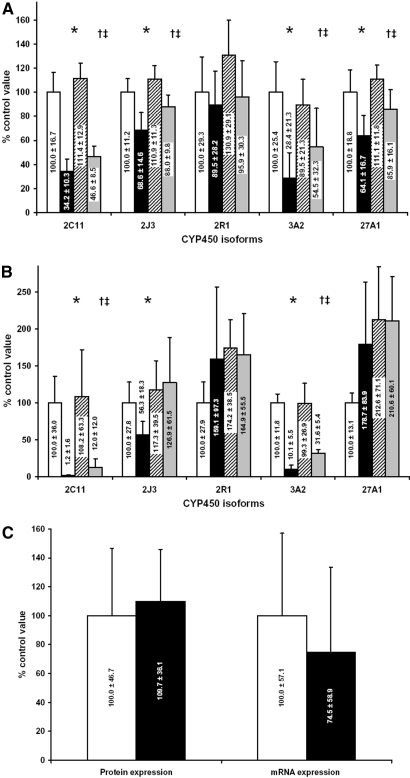
 ) after quantification by Western blot or quantitative PCR in the liver. (C) Protein and mRNA encoding for CYP24A1 are compared in control rats (□ and rats with CRF (■) after quantification by Western blot or quantitative PCR in the kidney. *P < 0.05 versus control rats; †P < 0.05 versus rats with CRF; ‡P < 0.05 versus control rats with PTX.
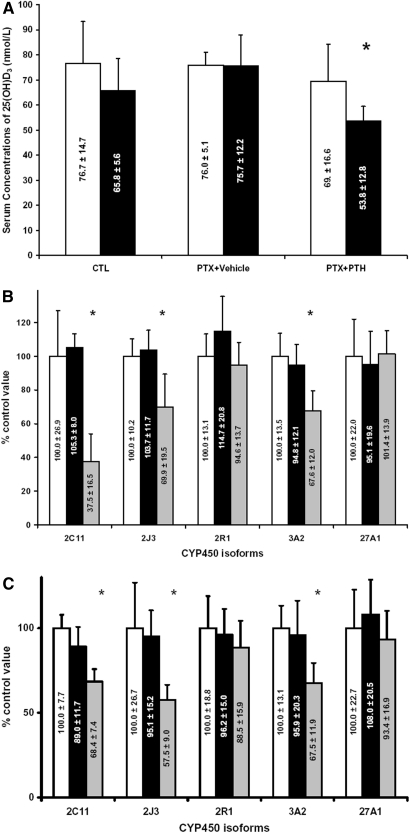 ) after quantification by Western blot or quantitative PCR in the liver. *P < 0.05 versus CTL rats.
References
-
- Elder GJ, Mackun K: 25-Hydroxyvitamin D deficiency and diabetes predict reduced BMD in patients with chronic kidney disease. J Bone Miner Res 21: 1778–1784, 2006 - PubMed
-
- LaClair RE, Hellman RN, Karp SL, Kraus M, Ofner S, Li Q, Graves KL, Moe SM: Prevalence of calcidiol deficiency in CKD: A cross-sectional study across latitudes in the United States. Am J Kidney Dis 45: 1026–1033, 2005 - PubMed
-
- Bouchard J, Ouimet D, Vallee M, Leblanc M, Pichette V: Effect of vitamin D supplementation on calcidiol and parathyroid hormone levels. Perit Dial Int 28: 565, 2008 - PubMed
-
- Bouchard J, Ouimet D, Vallee M, Lafrance JP, Leblanc M, Senecal L, Bonnardeaux A, Mathieu JP, Pichette V: Comparison of the prevalence of calcidiol insufficiency in predialysis and osteoporotic populations. Int Urol Nephrol 41: 983–988, 2009 - PubMed
-
- National Kidney Foundation: K/DOQI clinical practice guidelines for bone metabolism and disease in chronic kidney disease. Am J Kidney Dis 42: S1–S201, 2003 - PubMed
Publication types
MeSH terms
Substances
Grants and funding
LinkOut - more resources
Full Text Sources
Medical
