Use of photoactivation and photobleaching to monitor the dynamic regulation of E-cadherin at the plasma membrane
- PMID: 20595808
- PMCID: PMC3011267
- DOI: 10.4161/cam.4.4.12661
Use of photoactivation and photobleaching to monitor the dynamic regulation of E-cadherin at the plasma membrane
Abstract
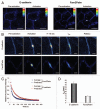
The dynamic control of E-cadherin is critical for establishing and maintaining cell-cell junctions in epithelial cells. The concentration of E-cadherin molecules at adherens junctions (AJs) is regulated by lateral movement of E-cadherin within the plasma membrane and endocytosis. Here we set out to study the interplay between these processes and their contribution to E-cadherin dynamics. Using photoactivation (PA) and fluorescence recovery after photobleaching (FRAP) we were able to monitor the fate of E-cadherin molecules within the plasma membrane. Our results suggest that the motility of E-cadherin within, and away from, the cell surface are not exclusive or independent mechanisms and there is a fine balance between the two which when perturbed can have dramatic effects on the regulation of AJs.
Figures


Similar articles
-
Endocytosis is required for E-cadherin redistribution at mature adherens junctions.Proc Natl Acad Sci U S A. 2009 Apr 28;106(17):7010-5. doi: 10.1073/pnas.0811253106. Epub 2009 Apr 16. Proc Natl Acad Sci U S A. 2009. PMID: 19372377 Free PMC article.
-
Real-time study of E-cadherin and membrane dynamics in living animals: implications for disease modeling and drug development.Cancer Res. 2009 Apr 1;69(7):2714-9. doi: 10.1158/0008-5472.CAN-08-4308. Epub 2009 Mar 24. Cancer Res. 2009. PMID: 19318551
-
E-cadherin dynamics is regulated by galectin-7 at epithelial cell surface.Sci Rep. 2017 Dec 6;7(1):17086. doi: 10.1038/s41598-017-17332-y. Sci Rep. 2017. PMID: 29213102 Free PMC article.
-
Adherens junction turnover: regulating adhesion through cadherin endocytosis, degradation, and recycling.Subcell Biochem. 2012;60:197-222. doi: 10.1007/978-94-007-4186-7_9. Subcell Biochem. 2012. PMID: 22674073 Free PMC article. Review.
-
Cadherin tales: Regulation of cadherin function by endocytic membrane trafficking.Traffic. 2016 Dec;17(12):1262-1271. doi: 10.1111/tra.12448. Epub 2016 Oct 27. Traffic. 2016. PMID: 27624909 Review.
Cited by
-
p120-catenin binding masks an endocytic signal conserved in classical cadherins.J Cell Biol. 2012 Oct 15;199(2):365-80. doi: 10.1083/jcb.201205029. J Cell Biol. 2012. PMID: 23071156 Free PMC article.
-
Live cell in vitro and in vivo imaging applications: accelerating drug discovery.Pharmaceutics. 2011 Apr 4;3(2):141-70. doi: 10.3390/pharmaceutics3020141. Pharmaceutics. 2011. PMID: 24310493 Free PMC article.
-
Intravital FRAP Imaging using an E-cadherin-GFP Mouse Reveals Disease- and Drug-Dependent Dynamic Regulation of Cell-Cell Junctions in Live Tissue.Cell Rep. 2016 Jan 5;14(1):152-167. doi: 10.1016/j.celrep.2015.12.020. Epub 2015 Dec 24. Cell Rep. 2016. PMID: 26725115 Free PMC article.
-
Developments in preclinical cancer imaging: innovating the discovery of therapeutics.Nat Rev Cancer. 2014 May;14(5):314-28. doi: 10.1038/nrc3724. Epub 2014 Apr 17. Nat Rev Cancer. 2014. PMID: 24739578 Review.
-
Tissue-specific transcriptional regulation of epithelial/endothelial and mesenchymal markers during renovascular hypertension.Mol Med Rep. 2019 Nov;20(5):4467-4476. doi: 10.3892/mmr.2019.10722. Epub 2019 Oct 2. Mol Med Rep. 2019. PMID: 31702037 Free PMC article.
References
-
- Thiery JP. Cell adhesion in development: a complex signaling network. Curr Opin Genet Dev. 2003;13:365–371. - PubMed
-
- Hajra KM, Fearon ER. Cadherin and catenin alterations in human cancer. Genes Chromosome Canc. 2002;34:255–268. - PubMed
-
- Nollet F, Berx G, van Roy F. The role of the E-cadherin/catenin adhesion complex in the development and progression of cancer. Mol Cell Biol Res Commun. 1999;2:77–85. - PubMed
-
- Yap AS. The morphogenetic role of cadherin cell adhesion molecules in human cancer: a thematic review. Cancer Invest. 1998;16:252–261. - PubMed
Publication types
MeSH terms
Substances
Grants and funding
LinkOut - more resources
Full Text Sources
Miscellaneous
