. 2010 Jul;5(7):1265-72.
doi: 10.1038/nprot.2010.76. Epub 2010 Jun 10.

Establishment of primary cultures of human brain microvascular endothelial cells to provide an in vitro cellular model of the blood-brain barrier

Affiliations

Establishment of primary cultures of human brain microvascular endothelial cells to provide an in vitro cellular model of the blood-brain barrier

Michael J Bernas et al. Nat Protoc. 2010 Jul.

Abstract

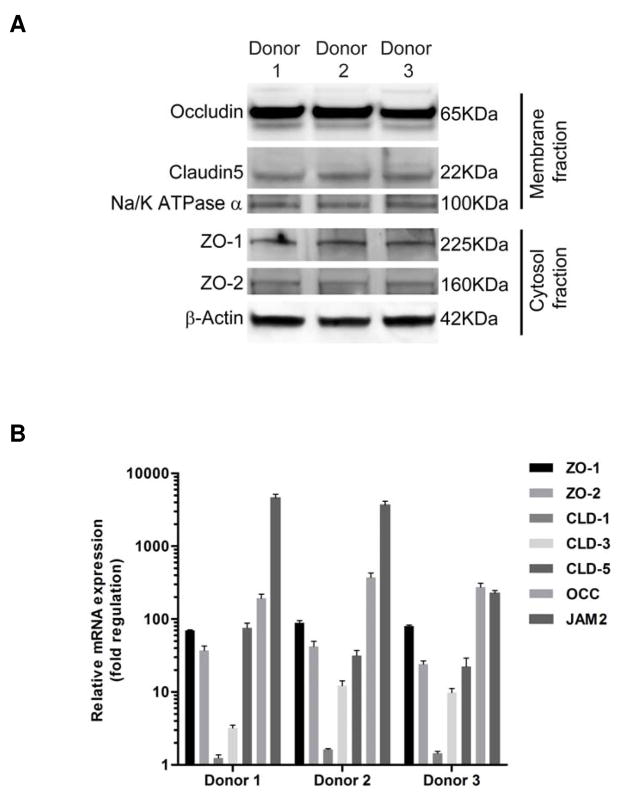
We describe a method for generating primary cultures of human brain microvascular endothelial cells (HBMVECs). HBMVECs are derived from microvessels isolated from temporal tissue removed during operative treatment of epilepsy. The tissue is mechanically fragmented and size filtered using polyester meshes. The resulting microvessel fragments are placed onto type I collagen-coated flasks to allow HBMVECs to migrate and proliferate. The overall process takes less than 3 h and does not require specialized equipment or enzymatic processes. HBMVECs are typically cultured for approximately 1 month until confluent. Cultures are highly pure ( approximately 97% endothelial cells; approximately 3% pericytes), are reproducible, and show characteristic brain endothelial markers (von Willebrand factor, glucose transporter-1) and robust expression of tight and adherens junction proteins as well as caveolin-1 and efflux protein P-glycoprotein. Monolayers of HBMVECs show characteristically high transendothelial electric resistance and have proven useful in multiple functional studies for in vitro modeling of the human blood-brain barrier.


Conflict of interest statement

Financial Interests

There are no competing financial interests by any of the authors.

Figures

Figure 1
Figure 1
Representative steps of the procedure to isolate and culture human brain microvascular endothelial cells. (A) Brain sample placed in a 100 mm dish containing isolation medium (IM); (B) removal of meninges and large vessels using sterilized surgical forceps and a stereomicroscope to facilitate the visualization; (C) fragmentation of the tissue by repeatedly sterile pipettes of 25 and 10 ml until (D) the sample can be passed effortlessly back and forth through a 5 ml pipette; (E) passage of the sample through a 500 μm polyester screen for removal of large fragments; (F) filtration of the collected fluid through a 30 μm polyester screen placed over a wire frame for support; (G) collection of the fragments retained on the screen by washing into a new dish; (H) pellet of fragments following centrifugation (note this picture depicts the collection of several membranes and the total volume is usually less); (I) resuspended microvessels and introduction to a collagen coated T-25 flask.
Fig. 2
Fig. 2
Phase contrast microscopy of human brain microvascular endothelial cells. Isolated brain microvascular fragments are obtained as a result of the procedure (A). Cells emerge from the end of these fragments over the first few days and form islands of cells with varying phenotypes as the density increases (B). As the confluent monolayers are formed in approximately one month, cell density increases and the cells display the typical cobblestone appearance (C-F). Scale bar = 100 μm.
Figure 3
Figure 3
Characterization of primary cultures of human brain microvascular endothelial cells by immunofluorescence microscopy. Brain endothelial cells were labeled for the glucose transporter-1 (A), and double-labeled for von Willebrand factor (vWF) and α-smooth muscle actin (αSMA) (B and C respectively). In C, a pericyte is visible, identified by the positive immunostaining for αSMA. For quantitative evaluation of the culture purity, the total number of nuclei, as well as the number of cells positive for vWF and for α-smooth muscle actin, were counted in 50 randomly selected fields (D). In A-C, nuclei were stained with Hoechst 33258 dye. Details of the immunocytochemical analysis are provided as supplementary method. Scale bar = 40 μm.
Figure 4
Figure 4
Immunofluorescent staining of confluent human brain microvascular endothelial cell monolayers for zonula occludens-1 (A,B; objective magnification 10x and 20x respectively), occludin (C,D; objective magnification 10x and 20x respectively), β-catenin (E), caveolin-1 (F), and P-glycoprotein (G) ( E-G; objective magnification 63x). Nuclei were stained with Hoechst 33258 dye. Details of the immunocytochemical analysis are provided as supplementary method. Scale bar = 100 μm for A, B, C, D and scale bar = 40 μm for E, F, G.
Figure 5
Figure 5
Western blot and q RT-PCR analysis of protein and mRNA expression in confluent monolayers of human brain microvascular endothelial cells (HBMVEC) between passages 1–3, from three different donors. A, Western Blot analysis of subcellular fractions were performed as previously described using antibodies against occludin, claudin-5, zonula occludens (ZO)-1, and ZO-2 (note: the Na+/K+ ATPase α1 and β-actin were used as internal/loading controls). B, Gene expression profile of tight junction proteins from donors in (A). Total RNA was isolated using the RNAqueous-4PCR kit (Ambion, Austin, TX) and RNA purity and concentration was determined with a NanoDrop ND-1000 spectrophotometer (Thermo Fisher Scientific, Wilmington, DE). The conversion to cDNA was performed by reverse transcription using 2 μg of total RNA with the High-Capacity cDNA Reverse Transcription Kit (ABI, Foster city, CA). The cDNA (diluted 1:20) template was then mixed with both the Taqman universal PCR master mix (ABI) and the corresponding human TaqMan Gene Expression Assay (CLD1: Hs01076359_m1, CLD3: Hs00265816_s1, CLD5: Hs01561351_m1, OCC: Hs00170162_m1, ZO-1: Hs01631876_m1, ZO-2: Hs00910541_m1 and JAM-2: Hs00221894_m1 from ABI) according to the manufacturer's instructions, for internal controls, the human TaqMan Gene Expression Assays for GAPDH and RPLPO (ABI) were also used. The qPCR was performed on an ABI StepOnePlus Real Time PCR system. The raw data was analyzed with the DataAssist software (ABI) using the delta-delta Ct method (Relative Quantification). The results are expressed in relative gene expression levels (fold) compared to a HEK293 control sample. CLD, claudin; OCC, occludin; JAM, junction adhesion molecule.
Figure 6
Figure 6
Transendothelial electric resistance (TEER) measured with the Electrical Cell-Substrate Impedance Sensing (ECIS) system (model 1600R, Applied Biophysics, Troy, NY). (A) ECIS device with electrode arrays (cultureware 8W10E+, Applied Biophysics) coupled with acquisition software to monitor TEER continuously. (B) TEER values shown as normalized resistance (subsequent values divided by initial values) from the initial plating of HBMVEC to confluence and barrier formation. The resistance, measured at 1hr intervals, increases over time until a steady state level is reached. (C) Evaluation of the barrier function in response to Lysophosphatidic acid (LPA) addition (arrow), measured at 10 min intervals for 24 h, where the precipitous decrease in TEER by LPA indicates a disruption or “leakiness” to the barrier. The results indicated by the graphs are represented as the average (line) normalized TEER ± SEM (n=3). Note only the positive SEM is shown for 5C.

References

    1. Persidsky Y, Ramirez SH, Haorah J, Kanmogne GD. Blood-brain barrier: structural components and function under physiologic and pathologic conditions. J Neuroimmune Pharmacol. 2006;1:223–236. - PubMed
    1. Weiss N, Miller F, Cazaubon S, Couraud PO. The blood-brain barrier in brain homeostasis and neurological diseases. Biochim Biophys Acta. 2009;1788:842–857. - PubMed
    1. Zlokovic BV. The blood-brain barrier in health and chronic neurodegenerative disorders. Neuron. 2008;57:178–201. - PubMed
    1. Ehrlich P. Das Sauerstoffbedürfnis des Organismus. Eine Farbenanalytische Studie; Hirschwald, Berlin: 1885.
    1. Joó F, Karnushina I. A procedure for the isolation of capillaries from rat brain. Cytobios. 1973;8:41–48. - PubMed

Publication types