

Triggering cell detachment from patterned electrode arrays by programmed subcellular release
- PMID: 20595956
- PMCID: PMC2911242
- DOI: 10.1038/nprot.2010.42
Triggering cell detachment from patterned electrode arrays by programmed subcellular release
Abstract
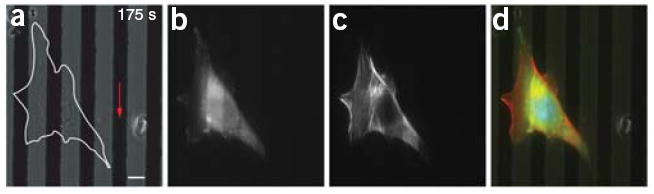
Programmed subcellular release is an in vitro technique for the quantitative study of cell detachment. The dynamics of cell contraction are measured by releasing cells from surfaces to which they are attached with spatial and temporal control. Release of subcellular regions of cells is achieved by plating cells on an electrode array created by standard microfabrication methods. The electrodes are then biochemically functionalized with an arginine-glycine-aspartic acid (RGD)-terminated thiol. Application of a voltage pulse results in electrochemical desorption of the RGD-terminated thiols, triggering cell detachment. This method allows for the study of the full cascade of events from detachment to subsequent subcellular reorganization. Fabrication of the electrode arrays may take 1-2 d. Preparation for experiments, including surface functionalization and cell plating, can be completed in 10 h. A series of cell release experiments on one device may last several hours.
Conflict of interest statement
Figures


Similar articles
-
A biological breadboard platform for cell adhesion and detachment studies.Lab Chip. 2011 Oct 21;11(20):3555-62. doi: 10.1039/c1lc20369j. Epub 2011 Aug 26. Lab Chip. 2011. PMID: 21874200
-
Cell adhesion and detachment on gold surfaces modified with a thiol-functionalized RGD peptide.Biomaterials. 2011 Oct;32(30):7286-96. doi: 10.1016/j.biomaterials.2011.05.077. Epub 2011 Aug 3. Biomaterials. 2011. PMID: 21813174
-
Catch and release cell sorting: electrochemical desorption of T-cells from antibody-modified microelectrodes.Colloids Surf B Biointerfaces. 2008 Jul 15;64(2):260-8. doi: 10.1016/j.colsurfb.2008.02.010. Epub 2008 Mar 10. Colloids Surf B Biointerfaces. 2008. PMID: 18394868
-
An integrated device for patterning cells and selectively detaching.Biomed Microdevices. 2012 Jun;14(3):471-81. doi: 10.1007/s10544-011-9624-5. Biomed Microdevices. 2012. PMID: 22327810
-
Vesicular exocytosis and microdevices - microelectrode arrays.Analyst. 2015 Jun 7;140(11):3687-95. doi: 10.1039/c4an01932f. Analyst. 2015. PMID: 25803190 Review.
Cited by
-
Tunable release of multiplex biochemicals by plasmonically active rotary nanomotors.Angew Chem Int Ed Engl. 2015 Feb 16;54(8):2525-9. doi: 10.1002/anie.201410754. Epub 2015 Jan 9. Angew Chem Int Ed Engl. 2015. PMID: 25580820 Free PMC article.
-
Efficient release of immunocaptured cells using coiled-coils in a microfluidic device.RSC Adv. 2019 Sep 17;9(50):29182-29189. doi: 10.1039/c9ra03871j. eCollection 2019 Sep 13. RSC Adv. 2019. PMID: 35528412 Free PMC article.
-
Probing cytoskeletal pre-stress and nuclear mechanics in endothelial cells with spatiotemporally controlled (de-)adhesion kinetics on micropatterned substrates.Cell Adh Migr. 2017 Jan 2;11(1):98-109. doi: 10.1080/19336918.2016.1182290. Epub 2016 Apr 25. Cell Adh Migr. 2017. PMID: 27111836 Free PMC article.
-
The physics of cancer: the role of physical interactions and mechanical forces in metastasis.Nat Rev Cancer. 2011 Jun 24;11(7):512-22. doi: 10.1038/nrc3080. Nat Rev Cancer. 2011. PMID: 21701513 Free PMC article. Review.
-
Tracking mechanics and volume of globular cells with atomic force microscopy using a constant-height clamp.Nat Protoc. 2012 Jan 5;7(1):143-54. doi: 10.1038/nprot.2011.434. Nat Protoc. 2012. PMID: 22222789
References
-
- Ruoslahti E. RGD and other recognition sequences for integrins. Ann Rev Cell Dev Biol. 1996;12:697–715. - PubMed
-
- Pesika NS, Stebe KJ, Searson PC. Kinetics of desorption of alkanethiolates on gold. Langmuir. 2006;22:3474–3476. - PubMed
-
- Widrig CA, Chung C, Porter MD. The electrochemical desorption of n-alkanethiol monolayers from polycrystalline Au and Ag electrodes. J Electroanal Chem. 1991;310:335–359.
Publication types
MeSH terms
Substances
Grants and funding
LinkOut - more resources
Full Text Sources
