. 2011 Jan;18(1):109-21.
doi: 10.1038/cdd.2010.75. Epub 2010 Jul 2.

Ciglitazone negatively regulates CXCL1 signaling through MITF to suppress melanoma growth

Affiliations

Ciglitazone negatively regulates CXCL1 signaling through MITF to suppress melanoma growth

T Botton et al. Cell Death Differ. 2011 Jan.

Abstract

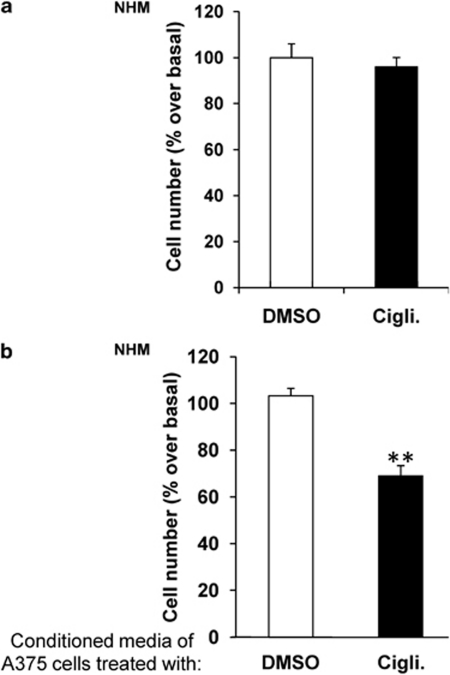
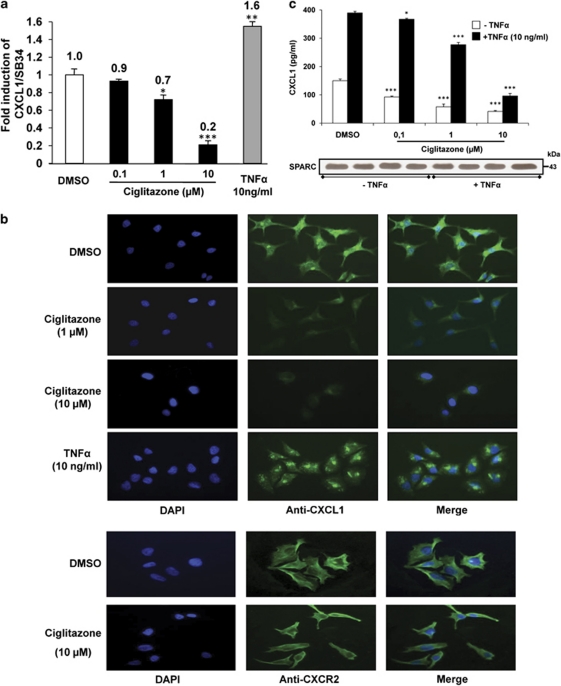
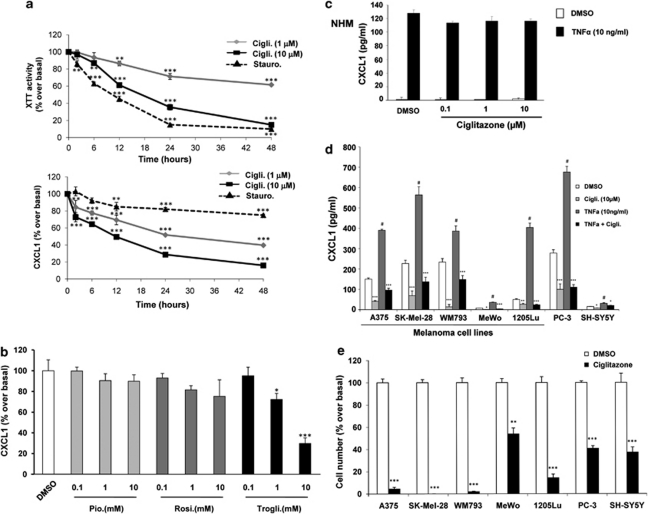
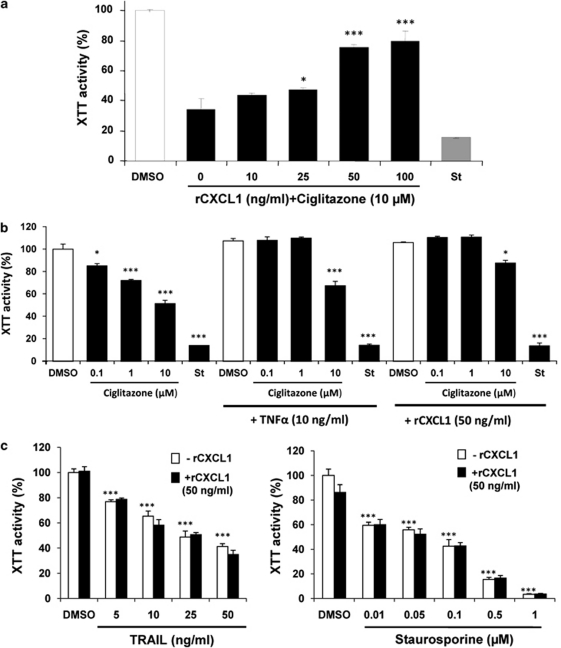
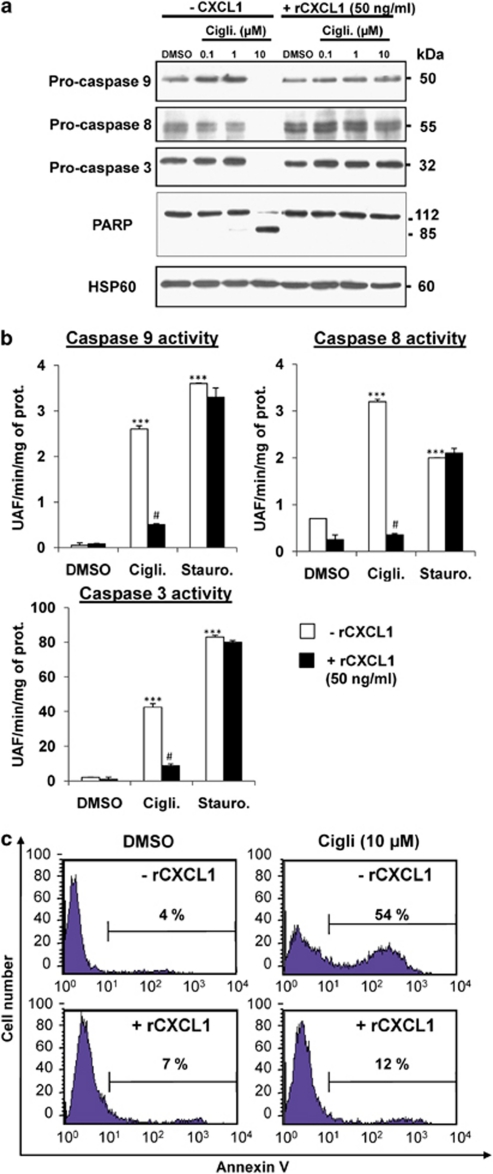
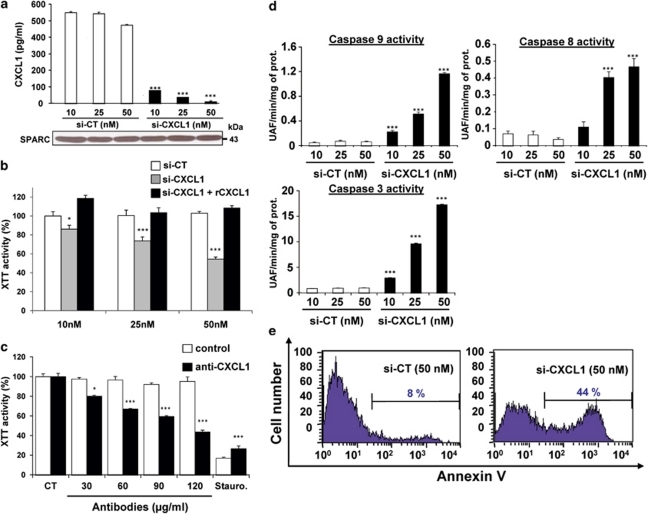
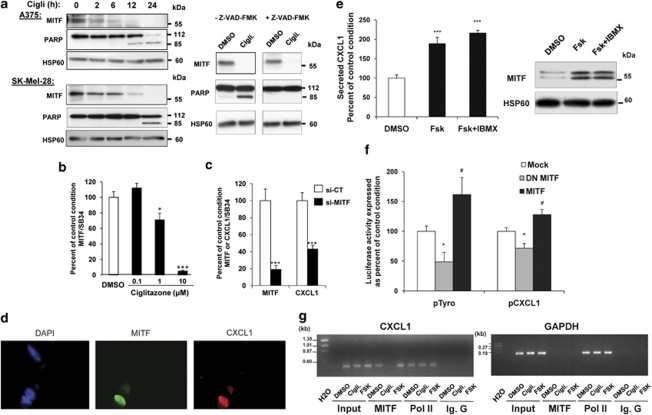
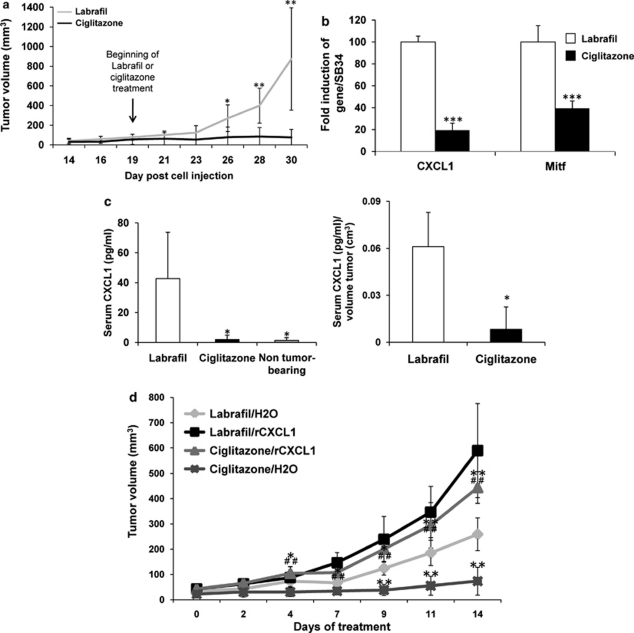
We have previously demonstrated that the thiazolidinedione ciglitazone inhibited, independently of PPARγ activation, melanoma cell growth. Further investigations now show that ciglitazone effects are mediated through the regulation of secreted factors. Q-PCR screening of several genes involved in melanoma biology reveals that ciglitazone inhibits expression of the CXCL1 chemokine gene. CXCL1 is overexpressed in melanoma and contributes to tumorigenicity. We show that ciglitazone induces a diminution of CXCL1 level in different human melanoma cell lines. This effect is mediated by the downregulation of microphthalmia-associated transcription factor, MITF, the master gene in melanocyte differentiation and involved in melanoma development. Further, recombinant CXCL1 protein is sufficient to abrogate thiazolidinedione effects such as apoptosis induction, whereas extinction of the CXCL1 pathway mimics phenotypic changes observed in response to ciglitazone. Finally, inhibition of human melanoma tumor development in nude mice treated with ciglitazone is associated with a strong decrease in MITF and CXCL1 levels. Our results show that anti-melanoma effects of thiazolidinediones involve an inhibition of the MITF/CXCL1 axis and highlight the key role of this specific pathway in melanoma malignancy.


Figures

Figure 1
Figure 1
Ciglitazone modifies melanoma cell secretome. (a) Starved normal human melanocytes (NHM) were treated or not with 10 μM ciglitazone (Cigli.) for 96 h. Cells were then harvested and counted using trypan blue. Results are expressed in percent of control (100%). (b) Starved A375 melanoma cells were treated or not with 10 μM ciglitazone for 24 h. Conditioned media were collected and centrifuged for 5 min at 2000 r.p.m. Supernatants were immediately added to the culture medium of NHM (1:1). After 96 h, NHM were harvested and counted using trypan blue. Results are expressed in percent of control (100%). Data are mean±S.D. of three independent experiments performed in triplicate, significantly different from the corresponding control **P<0.01
Figure 2
Figure 2
Ciglitazone decreases CXCL1 level in A375 melanoma cells. Starved A375 melanoma cells were treated for 24 h with various concentrations of ciglitazone or TNFα (10 ng/ml). (a) Total RNA was extracted and analyzed by real-time quantitative PCR using CXCL1 primers. mRNA expression was normalized using SB34 RNA level. Results are expressed as mean±S.D. from three independent experiments. Significantly different from the corresponding control *P<0.05; **P<0.01; ***P<0.001. (b) A375 cells were fixed and stained for CXCL1 or CXCR2 (green) and with DAPI (blue). DAPI staining was used to identify cell nucleus. Right panels show merger of DAPI and CXCL1 or CXCR2 staining. Slides were examined with a Zeiss Axiophot fluorescence microscope and pictures were taken at × 200 magnification. Representative field of three different experiments are shown. (c) ELISA of CXCL1 was performed on supernatants from starved A375 melanoma cells treated as indicated. Data are mean±S.D. of three independent experiments performed in triplicate. SPARC western blotting on those supernatants was used as loading control. Significantly different from the corresponding control *P<0.05; ***P<0.001
Figure 3
Figure 3
CXCL1 expression in response to various TZD and in different cell lines. (a) Time course of XTT activity (upper panel) and ELISA assay for CXCL1 (lower panel) were performed on starved A375 melanoma cells treated for different times with 1 or 10 μM ciglitazone or with staurosporine. Results are expressed in percent of control (100%) for each time. Data are mean±S.D. of three independent experiments performed in triplicate. (b) ELISA of CXCL1 was performed on supernatants from starved A375 melanoma cells treated for 24 h with different TZD: pioglitazone (Pio.), rosiglitazone (Rosi.), troglitazone (Trogli.). Results are expressed in percent of control (100%) for each time. Data are mean±S.D. of three independent experiments performed in triplicate. (c) ELISA of CXCL1 was performed on supernatants from starved normal human melanocytes (NHM) treated or not for 24 h with various concentrations of ciglitazone added or not with TNFα 10 ng/ml. Data are mean±S.D. of three independent experiments performed in triplicate. (d) ELISA of CXCL1 was performed on supernatants from different cell lines treated or not for 24 h with 10 μM of ciglitazone added or not with TNFα 10 ng/ml. Data are mean±S.D. of three independent experiments performed in triplicate. Significantly different from the corresponding control *P<0.05; **P<0.01; ***P<0.001; #P<0.05. (e) Starved cells from various cell lines were treated or not with 10 μM ciglitazone for 60 h. Cells were then harvested and counted using trypan blue. Results are expressed in percent of control (100%). Data are mean±S.D. of three independent experiments performed in triplicate
Figure 4
Figure 4
Recombinant CXCL1 is sufficient to abrogate decrease of cell viability induced by ciglitazone. XTT activity was performed on starved A375 melanoma cells treated with ciglitazone 10 μM added or not with various concentrations of recombinant CXCL1 (a), 10 ng/ml TNFα (b) or treated with various concentrations of TRAIL or staurosporine added with 50 ng/ml of recombinant CXCL1 (c). Results are expressed in percent of control (100%) for each time. Data are mean±S.D. of three independent experiments performed in triplicate. Significantly different from the corresponding control *P<0.05; ***P<0.001
Figure 5
Figure 5
Recombinant CXCL1 is sufficient to abrogate apoptosis induced by ciglitazone. Starved A375 melanoma cells were treated for 24 h with various concentrations of ciglitazone added or not with 50 ng/ml of recombinant CXCL1 (rCXCL1). (a) Western blot was performed on cell lysates (30 ìg total protein per lane). Proteins were separated by 10% SDS-PAGE and analyzed by western blot using the indicated antibody. HSP60 was used as loading control. One representative experiment of three is shown. (b) Caspase 3, 8 and 9 activities were performed on cell lysates (30 μg per condition). Lysate from cells treated for 5 h with 1 μM staurosporine was used as positive control of caspases activation. Results are expressed in relative fluorescence units per minute and per mg of protein (UAF/min/mg of prot.). Data are mean±S.D. of three independent experiments performed in triplicate. Significantly different from the corresponding control ***P<0.001; #P<0.05. (c) Cells were detached and stained with Annexin-V-Fluorescein before being analyzed by flow cytometry. Data are representative of three independent experiments performed in triplicate
Figure 6
Figure 6
Inhibition of CXCL1 decreases cell viability. (a) Starved A375 cells were transfected for 48 h with various concentrations of siRNA-targeting CXCL1 (si-CXCL1) or a scramble sequence (si-CT). ELISA for CXCL1 was performed on supernatants from transfected cells. Results are expressed in percent of control (100%). Data are mean±S.D. of three independent experiments performed in triplicate. SPARC western blotting on those supernatants was used as loading control. Significantly different from the corresponding control ***P<0.001. (b) XTT activity was performed on starved A375 transfected for 48 h with various concentrations of siRNA targeting CXCL1 and added or not with rCXCL1 (50 ng/ml). Results are expressed in percent of cells transfected with the control siRNA (100%) for each concentration. Data are mean±S.D. of three independent experiments performed in triplicate. Significantly different from the corresponding control *P<0.05; ***P<0.001. (c) XTT activity was performed on starved A375 treated for 24 h with various concentrations of blocking antibody targeting CXCL1. Results are expressed in percent of control (100%). Data are mean±S.D. of three independent experiments performed in triplicate. Significantly different from the corresponding control *P<0.05; ***P<0.001. (d) Caspase 3, 8 and 9 activities were performed on cell lysates (30 μg per condition) from starved A375 transfected for 48 h with various concentrations of control (CT) or CXCL1 siRNA. Results are expressed in relative fluorescence units per minute and per mg of protein (UAF/min/mg of prot.). Data are mean±S.D. of three independent experiments performed in triplicate. Significantly different from the corresponding control ***P<0.001. (e) Starved A375 cells were transfected for 48 h with 50 nM of siRNA targeting CXCL1 (si-CXCL1) or a scramble sequence (si-CT). Cells were detached and stained with Annexin-V-Fluorescein before being analyzed by flow cytometry. Data are representative of three independent experiments performed in triplicate
Figure 7
Figure 7
Decrease of CXCL1 mediated by ciglitazone involves MITF transcription factor. (a) On left panel, starved A375 or SK-Mel-28 melanoma cells were treated or not with 10 μM ciglitazone (Cigli.) at different times. On right panel, starved SK-Mel-28 were treated for 24 h with DMSO or ciglitazone added or not with 100 μM Z-VAD-FMK. Proteins were separated by 12% SDS-PAGE and analyzed by western blot using the indicated antibody. HSP60 was used as loading control. One representative experiment of three is shown. (b) Total RNA from starved A375 cells treated for 24 h with various concentrations of ciglitazone was extracted and analyzed by real-time quantitative PCR using MITF primers. mRNA expression was normalized using SB34 RNA levels. Results are expressed as mean±S.D. from three independent experiments. Significantly different from the corresponding control *P<0.05; ***P<0.001. (c) Total RNA from starved A375 cells transfected for 48 h with siRNA-targeting MITF (si-MITF) or its scramble sequence (si-CT) was extracted and analyzed by real-time quantitative PCR using MITF and CXCL1 primers. mRNA expression was normalized using SB34 RNA level. Results are expressed as mean±S.D. from three independent experiments. Significantly different from the corresponding control ***P<0.001. (d) A375 cells transfected with the wild type form of MITF were fixed and stained for MITF (green), CXCL1 (red) and with DAPI (blue). DAPI staining was used to identify cell nucleus. Slides were examined with a Zeiss Axiophot fluorescence microscope and pictures were taken at × 200 magnification. Representative field of three different experiments are shown. (e) Starved A375 melanoma cells were treated or not with 20 μM forskolin (Fsk) added or not with 100 μM IBMX for 7 h. ELISA of CXCL1 was performed on supernatants from starved A375 melanoma cells treated as described. Results are expressed in percent of control (100%). Corresponding proteins were separated by 12% SDS-PAGE and analyzed by western blot using the indicated antibody. HSP60 was used as loading control. One representative experiment of three is shown. Significantly different from the corresponding control ***P<0.001. (f) A375 cells were transfected with vector encoding the basal luciferase construct (Mock), wild-type MITF (WT MITF) or its dominant negative form (DN MITF) and with pTyro or pCXCL1 luciferase reporters. Measurement of luciferase activity was carried out 36 h after transfection. Variability of transfection was normalized with βGal activity and results were expressed in percent of control (100%). Data are mean±S.D. of three independent experiments performed in triplicate. Significantly different from the corresponding control *P<0.05; #P<0.05. (g) Chromatin immunoprecipitation assays were performed on extracts of cells treated for 24 h with DMSO, 10 μM ciglitazone (Cigli.) or with 20 μM forskolin (Fsk) for 7 h. Immunoprecipitations were performed using specific anti-MITF or anti-polymerase II (Pol II) antibody, and rabbit IgG (IgG) as control. Primers spanning the CXCL1 promoter region were used for the PCR amplification. A control of PCR amplification was performed on non-immunoprecipitated extracts (Input). Another control was performed using a primer pair to the human GAPDH promoter
Figure 8
Figure 8
In vivo antineoplastic effects of ciglitazone correlate with decrease of MITF and CXCL1 expression. (a) Mice were inoculated subcutaneously with A375 melanoma cells (2.5 × 10⁶), and after 19 days animals (n=6 in each group) were treated with ciglitazone (50 mg/kg/day) or labrafil for 11 days. Growth tumor curves were determined by measuring the tumor volume using the equation V=(L × W2)/2. Significantly different from the corresponding control *P<0.05; **P<0.01. (b) Total RNA was extracted from mice tumors and analyzed by real-time quantitative PCR using CXCL1 primers. mRNA expression was normalized using SB34 RNA level. Significantly different from the corresponding control ***P<0.001. (c) ELISA for CXCL1 was performed on mice sera from bleeding after 11 days of ciglitazone or labrafil treatment. Sera from non tumor-bearing animals were used as negative control. Data are mean±S.D. of six samples collected in each group. Significantly different from the corresponding control *P<0.05. Ratio serum CXCL1/tumor volume (right panel). (d) Mice were inoculated subcutaneously with A375 melanoma cells (2.5 × 10⁶), and after 12 days animals (n=6 in each group) received an intraperitoneal injection of ciglitazone (50 mg/kg/day) or labrafil and subcutaneous peritumoral injections of human recombinant CXCL1 (200 ng/tumor/day) or water for 14 days. Growth tumor curves were determined by measuring the tumor volume using the equation V=(L × W2)/2. Significantly different from Labrafil/H2O *P<0.05; **P<0.01. Significant difference between Ciglitazone/H2O and Ciglitazone/CXCL1 ##P<0.01

Similar articles

Cited by

References

    1. Herlyn M, Satyamoorthy K. Activated ras. Yet another player in melanoma. Am J Pathol. 1996;149:739–744. - PMC - PubMed
    1. Brose MS, Volpe P, Feldman M, Kumar M, Rishi I, Gerrero R, et al. BRAF and RAS mutations in human lung cancer and melanoma. Cancer Res. 2002;62:6997–7000. - PubMed
    1. Davies H, Bignell GR, Cox C, Stephens P, Edkins S, Clegg S, et al. Mutations of the BRAF gene in human cancer. Nature. 2002;417:949–954. - PubMed
    1. Villanueva J, Herlyn M. Melanoma and the tumor microenvironment. Curr Oncol Rep. 2008;10:439–446. - PMC - PubMed
    1. Demierre MF. Epidemiology and prevention of cutaneous melanoma. Curr Treat Options Oncol. 2006;7:181–186. - PubMed

Publication types

MeSH terms