. 2010 Jun 28;5(6):e11356.
doi: 10.1371/journal.pone.0011356.

Obstructive sleep apnea alters sleep stage transition dynamics

Affiliations

Obstructive sleep apnea alters sleep stage transition dynamics

Matt T Bianchi et al. PLoS One. .

Abstract

Introduction: Enhanced characterization of sleep architecture, compared with routine polysomnographic metrics such as stage percentages and sleep efficiency, may improve the predictive phenotyping of fragmented sleep. One approach involves using stage transition analysis to characterize sleep continuity.

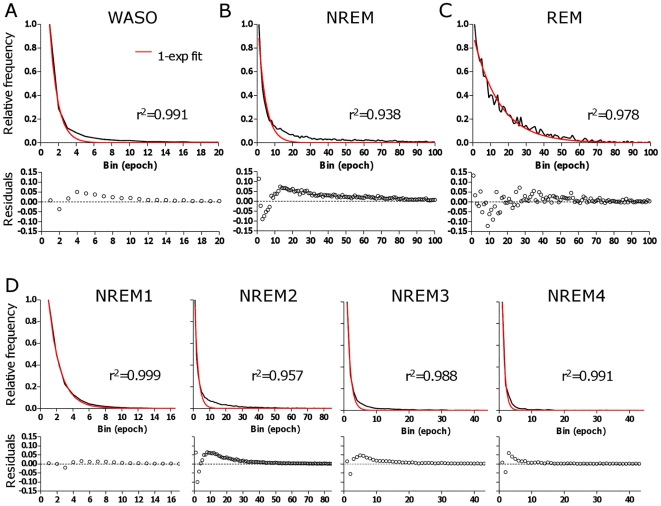
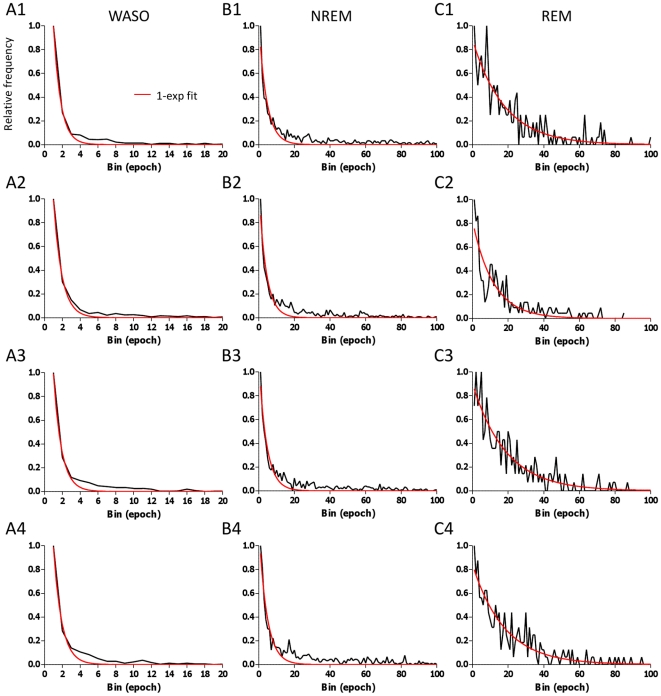
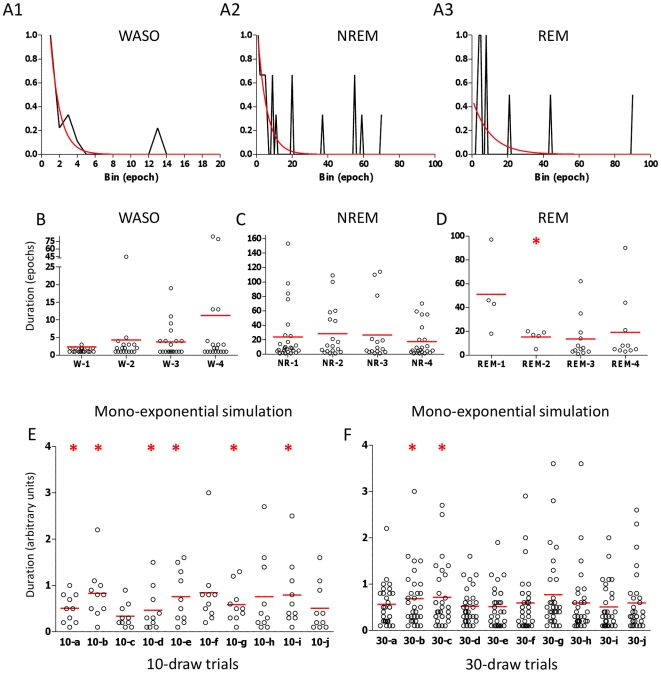
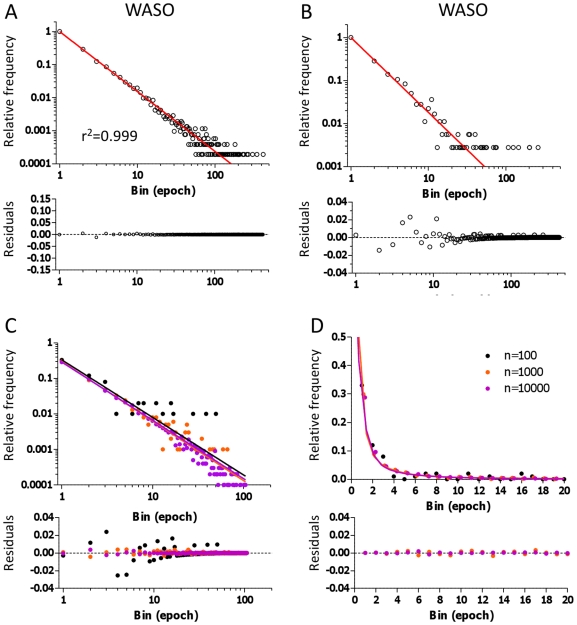
Methods and principal findings: We analyzed hypnograms from Sleep Heart Health Study (SHHS) participants using the following stage designations: wake after sleep onset (WASO), non-rapid eye movement (NREM) sleep, and REM sleep. We show that individual patient hypnograms contain insufficient number of bouts to adequately describe the transition kinetics, necessitating pooling of data. We compared a control group of individuals free of medications, obstructive sleep apnea (OSA), medical co-morbidities, or sleepiness (n = 374) with mild (n = 496) or severe OSA (n = 338). WASO, REM sleep, and NREM sleep bout durations exhibited multi-exponential temporal dynamics. The presence of OSA accelerated the "decay" rate of NREM and REM sleep bouts, resulting in instability manifesting as shorter bouts and increased number of stage transitions. For WASO bouts, previously attributed to a power law process, a multi-exponential decay described the data well. Simulations demonstrated that a multi-exponential process can mimic a power law distribution.

Conclusion and significance: OSA alters sleep architecture dynamics by decreasing the temporal stability of NREM and REM sleep bouts. Multi-exponential fitting is superior to routine mono-exponential fitting, and may thus provide improved predictive metrics of sleep continuity. However, because a single night of sleep contains insufficient transitions to characterize these dynamics, extended monitoring of sleep, probably at home, would be necessary for individualized clinical application.


Conflict of interest statement

Competing Interests: Dr. Thomas has consulted for Total Sleep Holdings; has a patent for CO2 adjunctive therapy for complex sleep apnea, ECG-based method to assess sleep stability and phenotype sleep apnea; and has financial interests in SomRx. Dr. Thomas, Dr. Peng and Mr. Mietus are part co-inventors of the sleep spectrogram method (licensed by the BIDMC to Embla), and share patent rights and royalties. Mr. Mietus has financial interests in DynaDx Corp. Dr. Peng has financial interests in DynaDx Corp. This does not alter our adherence to all the PLoS ONE policies on sharing data and materials. Dr Bianchi has indicated no financial conflicts of interest.

Figures

Figure 1
Figure 1. Frequency histogram analysis of bout durations in the control group.
The relative frequency of bouts in the control group is plotted against the duration of bouts (in bins of 30-second increments on the x-axis) for WASO (A), NREM (B), REM sleep (C) and sub-stages of NREM sleep (D) bouts. In each panel, the best fit single-exponential function (red) is overlaid, and the residuals (difference between data and fit) are plotted beneath each histogram.
Figure 2
Figure 2. Frequency histograms of random control subgroups.
The relative frequency of bouts from four groups of n = 30 randomly chosen individuals selected from the control dataset. Each row represents a different group. The relative frequency of bouts is plotted against the duration of bouts (30-second epoch bins) for WASO (column A), NREM (column B) and REM sleep (column C) bouts. The best single exponential fit is overlaid in red.
Figure 3
Figure 3. Effects of under-sampling on analysis of bout duration distributions.
The relative frequency histograms of WASO (A1) NREM (A2) and REM sleep (A3) bout durations are shown for a single, randomly selected patient from the control group for comparison with histograms from larger samples (Figures 1 and 2). The best single exponential fit is overlaid in red. Bout durations from four randomly selected individuals, are shown in panels B–D, including the single patient shown in panels A1–3 (which corresponds to patient #4 in panels B–D), to illustrate how the distributions can visually or statistically (asterisk) be mistaken as Gaussian. Under-sampling of simulated known monoexponential data leads to common mis-classification of the distribution as Gaussian (E; asterisks), and such mis-classification decreases as the number of samples increases (F).
Figure 4
Figure 4. Multi-exponential fits of bout durations and the impact of mild versus severe OSA.
Frequency histograms are shown for WASO (A), NREM (B), and REM sleep (C) bouts. Control distributions (black) are compared with those of mild OSA (green) and severe OSA (red). To illustrate visually the goodness of fit, the NREM (row D) and REM (row E) sleep histograms are shown separately, along with the time constants (tau) and % contribution of each exponential function. For NREM sleep, the optimal number of exponentials was three, while for REM sleep, the optimal number was two, regardless of OSA severity. Note the improved residual value patterns, compared to those of the mono-exponential fits from Figure 1.
Figure 5
Figure 5. Power Law analysis of WASO bout distributions.
The WASO frequency histogram from the control group is shown in log-log display (A), with the fitted power law overlaid in red. A 30-patient subset of WASO is shown in panel B for comparison. Various size samples drawn from three simulated exponential distributions (with time constants of 1, 5, and 25 epochs, chosen to produce relative contributions in exponential fitting of ∼95% fast, 4% intermediate, and ∼1% slow) are shown in log-log plot (C) and linear plots (D) for comparison of exponential and power law fitting.

Similar articles

Cited by

References

    1. Mahowald MW, Schenck CH. Insights from studying human sleep disorders. Nature. 2005;437:1279–1285. - PubMed
    1. Fuller PM, Gooley JJ, Saper CB. Neurobiology of the sleep-wake cycle: sleep architecture, circadian regulation, and regulatory feedback. J Biol Rhythms. 2006;21:482–493. - PubMed
    1. Espana RA, Scammell TE. Sleep neurobiology for the clinician. Sleep. 2004;27:811–820. - PubMed
    1. Siegel JM. Sleep viewed as a state of adaptive inactivity. Nat Rev Neurosci. 2009;10:747–753. - PMC - PubMed
    1. Chervin RD, Aldrich MS. The Epworth Sleepiness Scale may not reflect objective measures of sleepiness or sleep apnea. Neurology. 1999;52:125–131. - PubMed

Publication types