. 2010 Oct 21;10(20):2666-72.
doi: 10.1039/c004521g. Epub 2010 Jul 1.

Digital PCR on a SlipChip

Affiliations

Digital PCR on a SlipChip

Feng Shen et al. Lab Chip. .

Abstract

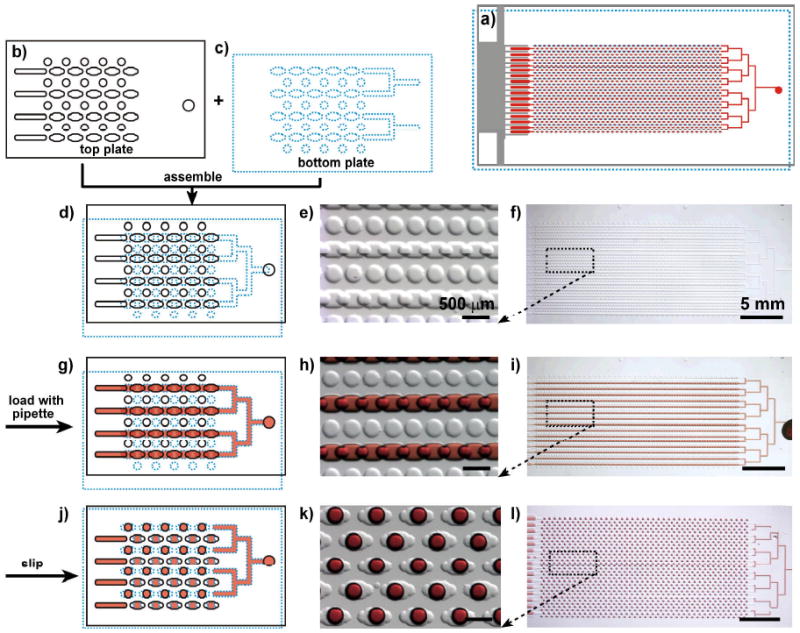
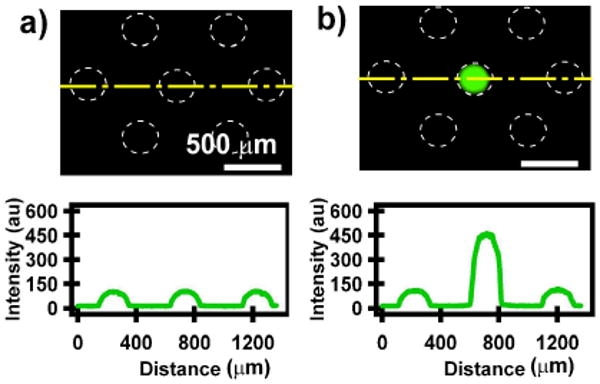
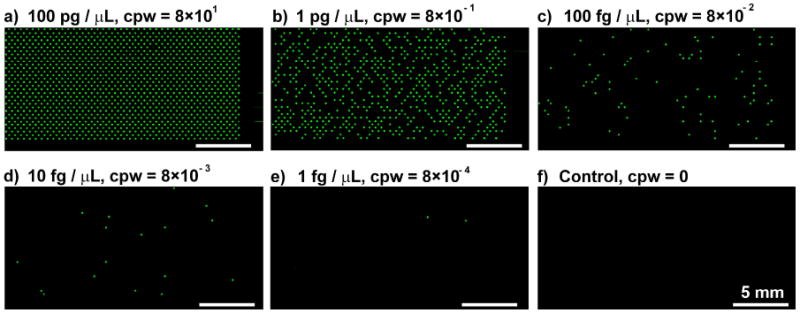
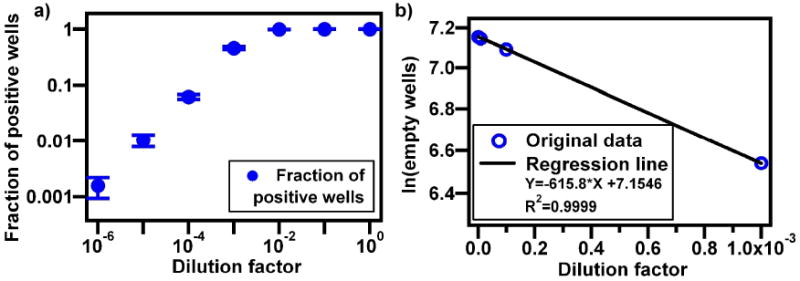
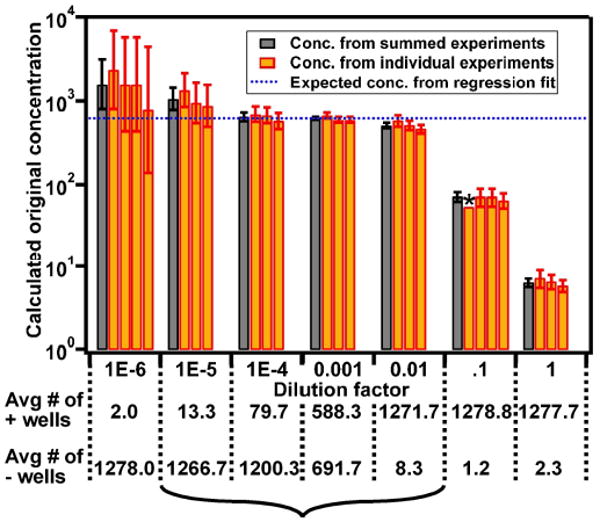
This paper describes a SlipChip to perform digital PCR in a very simple and inexpensive format. The fluidic path for introducing the sample combined with the PCR mixture was formed using elongated wells in the two plates of the SlipChip designed to overlap during sample loading. This fluidic path was broken up by simple slipping of the two plates that removed the overlap among wells and brought each well in contact with a reservoir preloaded with oil to generate 1280 reaction compartments (2.6 nL each) simultaneously. After thermal cycling, end-point fluorescence intensity was used to detect the presence of nucleic acid. Digital PCR on the SlipChip was tested quantitatively by using Staphylococcus aureus genomic DNA. As the concentration of the template DNA in the reaction mixture was diluted, the fraction of positive wells decreased as expected from the statistical analysis. No cross-contamination was observed during the experiments. At the extremes of the dynamic range of digital PCR the standard confidence interval determined using a normal approximation of the binomial distribution is not satisfactory. Therefore, statistical analysis based on the score method was used to establish these confidence intervals. The SlipChip provides a simple strategy to count nucleic acids by using PCR. It may find applications in research applications such as single cell analysis, prenatal diagnostics, and point-of-care diagnostics. SlipChip would become valuable for diagnostics, including applications in resource-limited areas after integration with isothermal nucleic acid amplification technologies and visual readout.


Figures

Figure 1
Figure 1
Schematic drawing and bright field images show the design and mechanism of the SlipChip for digital PCR. The top plate is outlined with a black solid line, the bottom plate is outlined with a blue dotted line, and red represents the sample. a) Schematic drawing shows the design of the entire assembled SlipChip for digital PCR after slipping. b) Schematic drawing of part of the top plate. c) Schematic drawing of part of the bottom plate. d-f) The SlipChip was assembled such that the elongated wells in the top and bottom plates overlapped to form a continuous fluidic path. g-i) The aqueous reagent (red) was injected into SlipChip and filled the chip through the connected elongated wells. j-l) The bottom plate was slipped relative to the top plate such that the fluidic path was broken up and the circular wells were overlaid with the elongated wells, and aqueous droplets were formed in each compartment. d, g, j) Schematic of the SlipChip; e, h, k) zoomed in microphotograph of the SlipChip; f, i, l) microphotograph of the entire SlipChip.
Figure 2
Figure 2
Amplification of single copy of gDNA by using digital PCR on the SlipChip. a) Fluorescence microphotograph shows part of the SlipChip before thermal cycling, and the linescan presents the fluorescence intensity along the yellow dashed line. The white dashed line outlines the edge of droplets formed in the wells. b) Fluorescence microphotograph acquired at the same position after thermal cycling: only the center well shows a significant increase in fluorescence from background. The linescan presents the fluorescence intensity along the yellow dashed line.
Figure 3
Figure 3
Digital PCR on the SlipChip with different concentrations of S aureus gDNA. a-e) Digital PCR on the Slipchip with a serial dilution of target DNA template ranging from 100 pg/μL to 1 fg/μL. Concentrations of gDNA and expected copies per well (cpw) are indicated above each figure. f) Control, no wells showed positive signal when no target DNA template was loaded.
Figure 4
Figure 4
Quantified results of digital PCR experiments. a) Experimental average fraction of positive wells as a function of dilution factor from an initial concentration of 1 ng of S aureus gDNA per μL. Error bars represent standard deviation of the experiment (n ≥ 3 for the experimental measurement of fraction of positive wells). b) Regression fit of results from the four most diluted samples (lowest dilution factors).
Figure 5
Figure 5
Analysis of experimental digital PCR data and of confidence intervals predicted by Equation 3. The expected concentration is shown by the blue dashed line, error bars represent the 95% confidence interval. High concentrations saturate the system resulting in incorrect, too-low measurements. The rest of the range gives a more accurate measurement, particularly the range indicated by the bracket. *This experiment resulted in 1280 positive wells so only a lower limit can be determined.

Similar articles

Cited by

References

    1. Vogelstein B, Kinzler KW. Proc Natl Acad Sci U S A. 1999;96:9236–9241. - PMC - PubMed
    1. Ottesen EA, Hong JW, Quake SR, Leadbetter JR. Science. 2006;314:1464–1467. - PubMed
    1. Warren L, Bryder D, Weissman IL, Quake SR. Proc Natl Acad Sci U S A. 2006;103:17807–17812. - PMC - PubMed
    1. Marcus JS, Anderson WF, Quake SR. Anal Chem. 2006;78:3084–3089. - PubMed
    1. Lo YMD, Lun FMF, Chan KCA, Tsui NBY, Chong KC, Lau TK, Leung TY, Zee BCY, Cantor CR, Chiu RWK. Proc Natl Acad Sci U S A. 2007;104:13116–13121. - PMC - PubMed

Publication types

MeSH terms