. 2010 Dec;164(4):1083-94.
doi: 10.1007/s00442-010-1699-9. Epub 2010 Jul 2.

Leaf litter decomposition in temperate deciduous forest stands with a decreasing fraction of beech (Fagus sylvatica)

Affiliations

Leaf litter decomposition in temperate deciduous forest stands with a decreasing fraction of beech (Fagus sylvatica)

Mascha Jacob et al. Oecologia. 2010 Dec.

Abstract

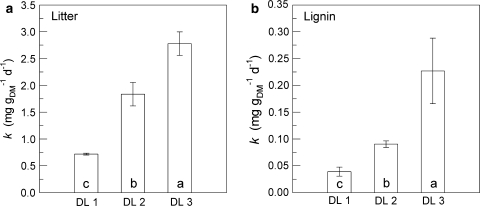
We hypothesised that the decomposition rates of leaf litter will increase along a gradient of decreasing fraction of the European beech (Fagus sylvatica) and increasing tree species diversity in the generally beech-dominated Central European temperate deciduous forests due to an increase in litter quality. We studied the decomposition of leaf litter including its lignin fraction in monospecific (pure beech) stands and in stands with up to five tree genera (Acer spp., Carpinus betulus, Fagus sylvatica, Fraxinus excelsior, Tilia spp.) using a litterbag approach. Litter and lignin decomposition was more rapid in stand-representative litter from multispecific stands than in litter from pure beech stands. Except for beech litter, the decomposition rates of species-specific tree litter did not differ significantly among the stand types, but were most rapid in Fraxinus excelsior and slowest in beech in an interspecific comparison. Pairwise comparisons of the decomposition of beech litter with litter of the other tree species (except for Acer platanoides) revealed a "home field advantage" of up to 20% (more rapid litter decomposition in stands with a high fraction of its own species than in stands with a different tree species composition). Decomposition of stand-representative litter mixtures displayed additive characteristics, not significantly more rapid than predicted by the decomposition of litter from the individual tree species. Leaf litter decomposition rates were positively correlated with the initial N and Ca concentrations of the litter, and negatively with the initial C:N, C:P and lignin:N ratios. The results support our hypothesis that the overall decomposition rates are mainly influenced by the chemical composition of the individual litter species. Thus, the fraction of individual tree species in the species composition seems to be more important for the litter decomposition rates than tree species diversity itself.


Figures

Fig. 1
Fig. 1
Decomposition of a foliar litter and b foliar lignin in percent of their initial mass in the MIX litterbags (representing the bulk litter of the individual stands) incubated in temperate deciduous forest stands differing in tree species diversity (DL 1–3) from November 2005 until a September 2007 (entire incubation period, 22 months) or b September 2006 (initial 10 months of the incubation) (means ± 1SE). Different capital letters next to the symbol legends indicate significant differences among DL for the entire time course (Friedman test, followed by multiple pairwise comparisons using the Student–Newman–Keuls test, P < 0.05; no significant difference among DL for the entire time course in the case of bulk litter). Different lower case letters indicate significant differences among DL on a given date (Kruskal–Wallis test, followed by multiple pairwise U tests; P < 0.05) (the latter test was not performed on the lignin values due to a lack of repetitive analyses on some dates)
Fig. 2
Fig. 2
Decomposition rates (k; related to the initial litter mass) of (a) litter and (b) lignin in stand-specific MIX litterbags incubated in temperate deciduous forest stands differing in their level of tree species diversity (DL 1–3). The rates were calculated for November 2005–June 2006 (means ± 1 SE). Different lower case letters indicate significant differences among DL (Kruskal–Wallis test, followed by multiple pairwise U tests; P < 0.05)
Fig. 3
Fig. 3
Decomposition of (a) foliar litter and (b) foliar lignin of different temperate deciduous forest tree species in percent of their initial mass in MONO litterbags (average values of bags incubated in stands of the three tree species diversity levels DL 1–3) (means ± 1SE). Different capital letters next to the symbol legends indicate significant differences among tree species for the entire time course (Friedman test, followed by multiple pairwise comparisons using the Student Newman–Keuls test; P < 0.05) in the case of litter decomposition (no significant differences in the case of lignin decomposition). Different lower case letters indicate significant differences among tree species on a given date (Kruskal–Wallis test, followed by multiple pairwise U tests; P < 0.05)
Fig. 4
Fig. 4
Decomposition rates (k; related to the initial litter mass) of litter (a,b) and lignin (c,d) in tree species-specific MONO litterbags incubated in temperate deciduous forest stands differing in their level of tree species diversity (DL 1–3). The rates were calculated for November 2005–June 2006 (means ± 1 SE). The means were averaged for a given DL from the litter of all tree species incubated there (A. platanoides, C. betulus, F. sylvatica, F. excelsior, T. cordata) (a,c), or over all DL (DL 1–3) for a given tree species (b,d). Different lower case letters indicate significant differences among the tree species (ANOVA, followed by post-hoc LSD tests; P < 0.05). Differences among DL were not significant
Fig. 5
Fig. 5
Predicted (on the basis of MONO litterbags) and measured percentages (in MIX litterbags) of the different tree species’ foliar litter remaining after 7 months of incubation in all DL (DL 1–3). The diagonal line represents a 1:1 ratio. Within a given tree species, the differences between measured and predicted differences were not significant (t test for paired differences). For the explanation of symbols, see Fig. 3
Fig. 6
Fig. 6
Rates of litter decomposition (k) plotted against the initial concentrations or ratios of nutrients or lignin in the litter from tree species-specific MONO litterbags incubated in temperate deciduous forest stands differing in the level of tree species diversity. Mean values of the DL were used for each tree species. The decomposition rates were calculated for November 2005–June 2006. In cases of significant (P < 0.05) Pearson correlation coefficients (r), r and the respective levels of significance are given. For the explanation of symbols, see Fig. 3

References

    1. Ad-hoc-Arbeitsgruppe Boden (2005) Bodenkundliche Kartieranleitung. Schweizerbart’sche Verlagsbuchhandlung, Stuttgart
    1. Aerts R. Climate, leaf litter chemistry and leaf litter decomposition in terrestrial ecosystems: a triangular relationship. Oikos. 1997;79:439–449. doi: 10.2307/3546886. - DOI
    1. Ayres E, Steltzer H, Berg S, Wall DH. Soil biota accelerate decomposition in high-elevation forests by specializing in the breakdown of litter produced by the plant species above them. J Ecol. 2009;97:901–912. doi: 10.1111/j.1365-2745.2009.01539.x. - DOI
    1. Ayres E, Steltzer H, Simmons BL, Simpson RT, Steinweg JM, Wallenstein MD, Mellor N, Parton WJ, Moore JC, Wall DH. Home-field advantage accelerates leaf litter decomposition in forests. Soil Biol Biochem. 2009;41:606–610. doi: 10.1016/j.soilbio.2008.12.022. - DOI
    1. Ball BA, Hunter MD, Kominoski JS, Swan CM, Bradford MA. Consequences of non-random species loss for decomposition dynamics: experimental evidence for additive and non-additive effects. J Ecol. 2008;96:303–313. doi: 10.1111/j.1365-2745.2007.01346.x. - DOI

Publication types

LinkOut - more resources