. 2010 Jul;32(1):41-52.
doi: 10.1111/j.1460-9568.2010.07244.x. Epub 2010 Jun 28.

Cerebellar cortical output encodes temporal aspects of rhythmic licking movements and is necessary for normal licking frequency

Affiliations

Cerebellar cortical output encodes temporal aspects of rhythmic licking movements and is necessary for normal licking frequency

Jerí L Bryant et al. Eur J Neurosci. 2010 Jul.

Abstract

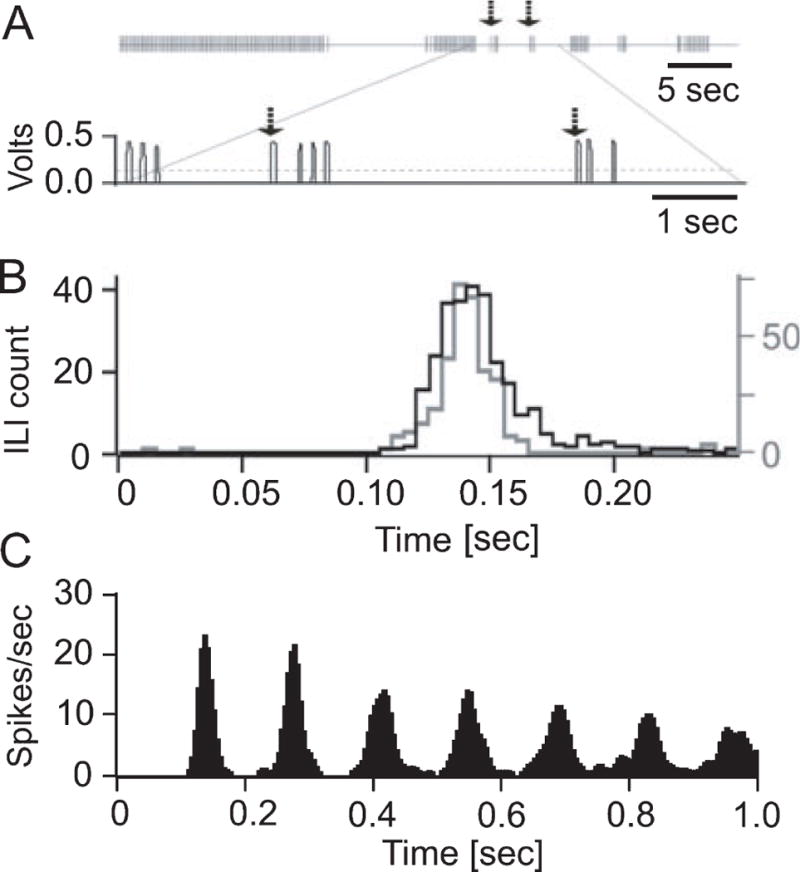
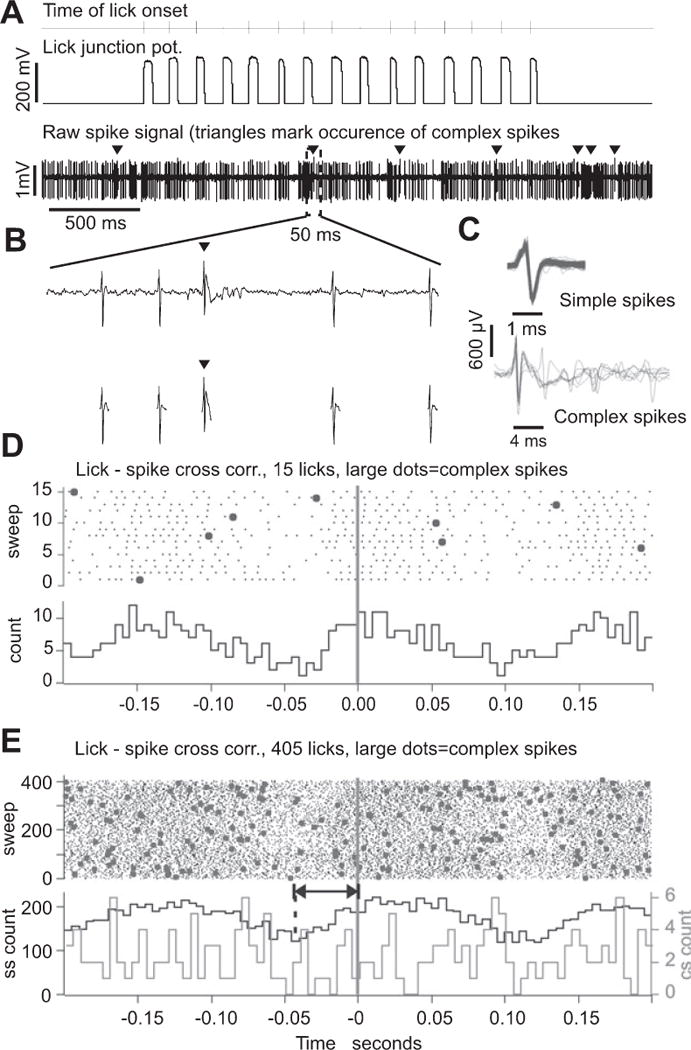
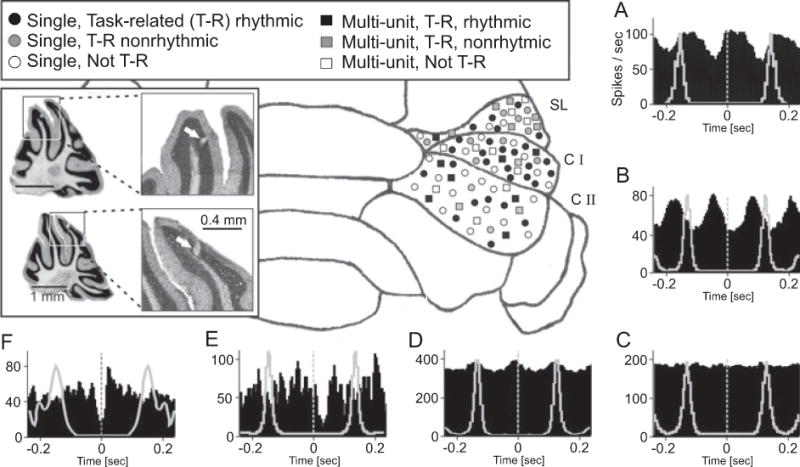
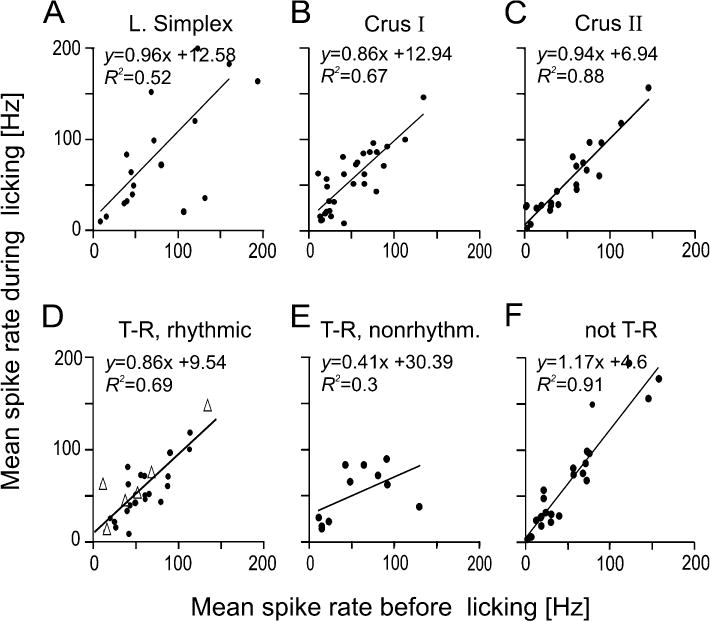
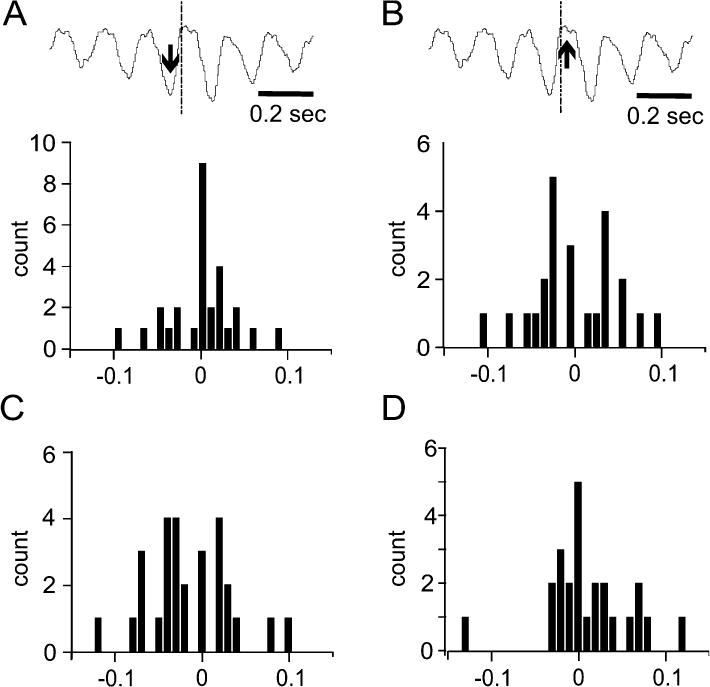
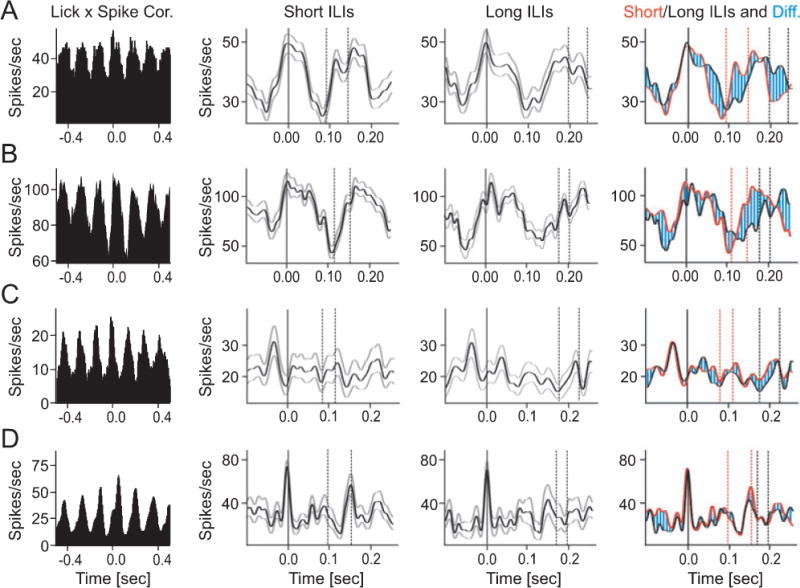
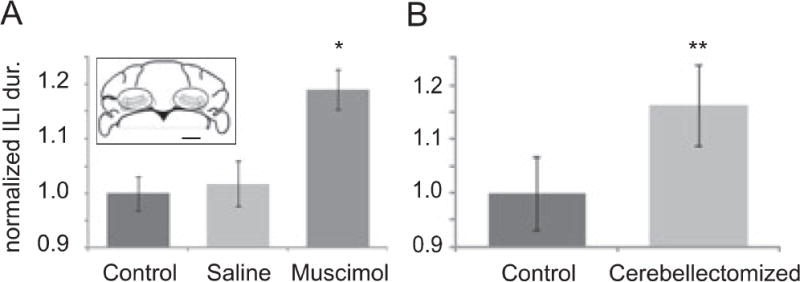
Rodents consume water by performing stereotypic, rhythmic licking movements that are believed to be controlled by brainstem pattern-generating circuits. Previous work has shown that synchronized population activity of inferior olive neurons was phase-locked to the licking rhythm in rats, suggesting a cerebellar involvement in temporal aspects of licking behavior. However, what role the cerebellum has in licking behavior and whether licking is represented in the high-frequency simple spike output of Purkinje cells remains unknown. We recorded Purkinje cell simple and complex spike activity in awake mice during licking, and determined the behavioral consequences of loss of cerebellar function. Mouse cerebellar cortex contained a multifaceted representation of licking behavior encoded in the simple spike activities of Purkinje cells distributed across Crus I, Crus II and lobus simplex of the right cerebellar hemisphere. Lick-related Purkinje cell simple spike activity was modulated rhythmically, phase-locked to the lick rhythm, or non-rhythmically. A subpopulation of lick-related Purkinje cells differentially represented lick interval duration in their simple spike activity. Surgical removal of the cerebellum or temporary pharmacological inactivation of the cerebellar nuclei significantly slowed the licking frequency. Fluid licking was also less efficient in mice with impaired cerebellar function, indicated by a significant decline in the volume per lick fluid intake. The gross licking movement appeared unaffected. Our results suggest a cerebellar role in modulating the frequency of the central pattern-generating circuits controlling fluid licking and in the fine coordination of licking, while contributing little to the coordination of the gross licking movement.


Figures

Figure 1
Figure 1
Temporal structure of licking behavior in mice. (A) A typical raw data example of mouse licking behavior recorded during head fixation. Each vertical line in the upper trace represents one lick. The lower trace shows the raw lick voltage signals corresponding to the area in the upper trace indicated by the lines. The dashed line indicates the voltage threshold used to detect lick times at the ascending slope of the voltage step, i.e. at the beginning of the tongue to waterspout contact. Typically mice licked in bursts of licks with the number of licks per burst being highly variable. The upper row in Fig. 1 shows 7 lick bursts. In the lower trace the last few licks of the second burst and the short 3rd and 4th bursts are shown Arrows in the upper and lower trace mark the onsets of 3rd and 4th lick bursts. (B) Inter-lick interval distributions of licking behavior recorded prior to surgery (black histogram) and during a typical experimental session (gray histogram) involving head fixation and recording of neuronal activity. The two distributions are nearly identical, demonstrating that head fixation did not affect the licking rhythm. (C) The autocorrelation analysis of the licking behavior shown in (A) exhibits multiple equidistant side peaks, indicative of a highly regular lick rhythm.
Figure 2
Figure 2
Correlation between Purkinje cell spike activity and licking behavior. (A) Top trace: tick-marks show the times of lick onset, i.e. the time when the tongue touched the water spout. Middle trace: raw junction potential signals generated by 15 licks. Lower trace: simple and complex spike activity of a Purkinje cell recorded simultaneously with the licks. Arrowheads mark the occurrence of complex spikes. (B) Top trace: expansion of the raw spike signal containing four simple and one complex spike. Bottom trace: cutouts of simple and complex spikes after spike sorting based on differences in spike shapes. (C) Ten superimposed simple spikes (top) and ten superimposed complex spikes (bottom) from the data shown in (A) and (B). Voltage scale applies to both sets of traces, time scales are different. (D) Lick-spike cross correlation calculated for the burst of 15 licks and the segment spike activity shown in (A). Zero marks lick onset time, i.e. the time of tongue to spout contact. The large dots in the raster plots represent complex spikes. (E) Lick-spike cross correlation calculated for the same Purkinje cell but for >400 licks, including the 15 shown in (A). Bin width for both cross correlation histograms is 5 ms.
Figure 3
Figure 3
Neuronal representation of licking behavior in the cerebellar hemisphere. Summary of electrophysiological results showing recording locations and classifications of Purkinje cell activity recorded during licking behavior. (A–F) Cross-correlation analysis (black histograms) of simple spike and licking behavior revealed different classes of Purkinje cells defined by different temporal relationships between Purkinje cell activity and licking. To illustrate the phase relationship between spike modulation and lick rhythm the autocorrelogram of the licking behavior is plotted with gray lines in each correlation histogram. The neuronal activity recorded during licking was categorized as described in details in the main text. Examples show are: (A) Lick-related, rhythmically modulated single unit; (B) Lick-related, rhythmically modulated multi-unit recording; (C) Not lick-related, Multi-unit; (D) Lick-related, weakly modulated rhythmic multi-unit; (E) Nonrhythmic, lick-related multi-unit; and (F) Nonrhythmic, lick-related single-unit. The symbols in the schematic map of the cerebellar cortex represent the different response types described in the legend and indicate the approximate recording site. The inset shows photomicrographs of Nissl stained 50 μm sagittal slices with electrolytic lesions marking recording sites. Top: lesion in the simple lobule, Bottom: lesion in Crus I. Bin width in all histograms is 5 ms. Histograms were smoothed with a 3 point Gaussian. SL= Simple Lobule, CI = Crus I lobule, CII = Crus II lobule.
Figure 4
Figure 4
Scatter plots comparing the base line simple spike rates of single unit Purkinje cells before and during licking behavior. (A–C) Comparison by lobule. The top row of scatter plots display a comparison of spike rates before and during licking for single units segregated by the lobule in which each unit was recorded. The equation from the linear regression analysis and the coefficient of determination is shown for each data set. While no region displayed a significant difference between firing rates before and during licking, Purkinje cells in Crus II displayed the least variability in firing rate. (D–F) Comparison by response type. Single unit firing rates before and during licking for different response types: (D) Lick-related, rhythmic single units showed no change in firing rates among those with a strong rhythmic firing pattern (black dots) and those that were weakly correlated (white triangles). (E) Lick-related, nonrhythmic single units displayed the most variance between firing rates before and during licking. (F) Nonlick-related units showed no change to firing rates before and during licking.
Figure 5
Figure 5
Phase relationship between single unit spike activity and licking across all licks (A,B) and for the first licks of each lick bust only (C,D). The delays between spike rate minima and maxima and lick onset times were measured as described in the method section and as shown in the example cross correlogram plotted above the two histograms in (A) and (B). Vertical lines in the example correlogram indicate time zero, i.e. the time of tongue to waterspout contact. Arrows point to the minimum (A) and maximum (B) nearest to time zero. (A), Temporal relationship of spike rate minima and licking expressed in a probability distribution of delays between rate minima and time of tongue to water spout contact. In the example the nearest-to-zero firing rate minimum (down arrow) occurred at −0.045 seconds. (B) As in (A) but for spike rate maxima. In the example the nearest-to-zero firing rate maximum (up arrow) occurred at 0.018 seconds. (C) Temporal relationship of spike rate minima with first licks or single licks only expressed in a probability distribution of delays between rate minima and time of tongue to water spout contact. (D) As in (C) but for spike rate maxima. Bin width: 10 ms.
Figure 6
Figure 6
Inter-lick interval duration is represented in Purkinje cell simple spike activity. The average firing rates of four rhythmically modulated lick-related Purkinje cells (A–D) were calculated separately for the 30 shortest and 30 longest inter-lick intervals (ILIs) in the data set. The histograms in the left column show the lick-spike correlations (all licks included) for the four units. The center two columns show average spike rate trajectories (black curves) recorded during short (center left) and long (center right) ILIs. Gray curves mark +/− one standard deviation. Solid vertical lines in each histogram mark the times of tongue to water spout contact, dashed vertical lines delimit the time intervals within which the next tongue contact occurred. The right-most column shows an overlay of the data in the two center columns with responses during short ILIs shown in red, responses during long ILIs shown in black and the difference hatched in blue. The time course of the spikes rates of units (A) and (B) were different during long and short ILIs. Spike rate minima and maxima occurring earlier during short ILIs than during long ILIs. Units (C) and (D) generated similar spike rate patterns during long and short ILIs. All of the cross correlations contained 5 ms bins that were smoothed with a 3-point Gaussian function.
Figure 7
Figure 7
Loss of cerebellar function significantly slows the licking rhythm. (A) Average lick interval durations increase significantly following bilateral microinjections of muscimol into the cerebellar nuclei compared to pre-treatment values and to control conditions involving bilateral injections of saline (n = 9). ILI values are normalized to the pre-treatment values. Error bars depict standard error and the asterisk statistical significance at P < 0.05. The inset shows a line drawing of a coronal section of the mouse cerebellum at 6 mm posterior to bregma, where injections into the cerebellar nuclei were made. Ovals outline the approximate regions targeted by the bilateral injections of muscimol. The small bar in the lower right corner represents 1 mm. B) Average inter lick interval duration of mice that were cerebellectomized at postnatal day 14 (n = 7) and of healthy litter mates (n = 7) Cerebellectomized mice had longer inter lick intervals and thus a slower lick rhythm than normal mice (P < 0.05, Student’s t-test). ILI values are normalized to average ILI of healthy or untreated mice in A and B.

Similar articles

Cited by

References

    1. Albus JS. A theory of cerebellar function. Mathematical Biosci. 1971;10:25–61.
    1. Asanuma C, Thach WT, Jones EG. Brainstem and spinal projections of the deep cerebellar nuclei in the monkey, with observations on the brainstem projections of the dorsal column nuclei. Brain Res. 1983;286:299–322. - PubMed
    1. Barlow SM. Central pattern generation involved in oral and respiratory control for feeding in the term infant. Curr Opin Otolaryngol Head Neck Surg. 2009;17:187–193. - PMC - PubMed
    1. Boughter JD, Baird JD, Bryant JL, St John SJ, Heck DH. C57BL/6J and DBA/2J Mice Vary in Lick rate and Ingestive Microstructure. Genes, Brain and Behavior. 2007;6:619–627. - PubMed
    1. Boyden ES, Katoh A, Raymond JL. Cerebellum-dependent learning: the role of multiple plasticity mechanisms. Annu Rev Neurosci. 2004;27:581–609. - PubMed

Publication types