. 2010 Aug;32(3):448-57.
doi: 10.1111/j.1460-9568.2010.07295.x. Epub 2010 Jun 30.

GABAergic neurons intermingled with orexin and MCH neurons in the lateral hypothalamus discharge maximally during sleep

Affiliations

GABAergic neurons intermingled with orexin and MCH neurons in the lateral hypothalamus discharge maximally during sleep

Oum Kaltoum Hassani et al. Eur J Neurosci. 2010 Aug.

Abstract

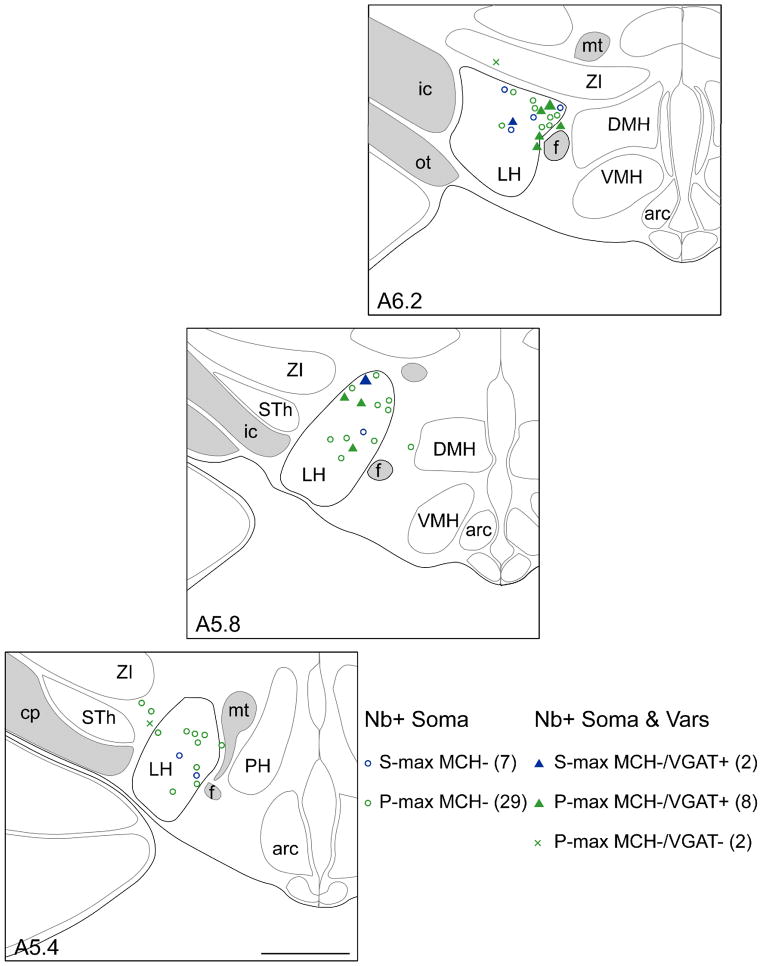
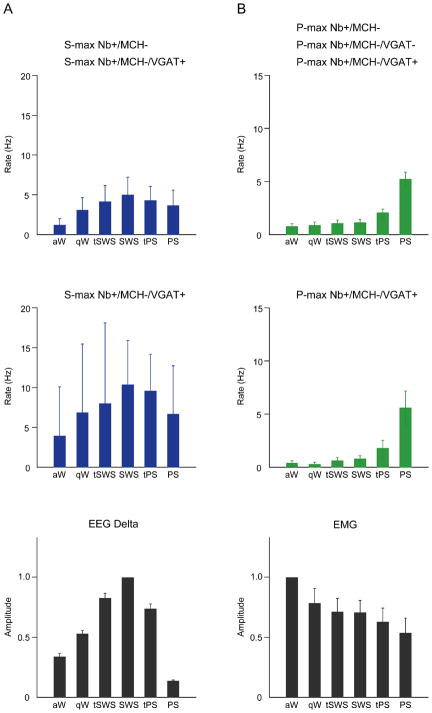
The lateral hypothalamus (LH), where wake-active orexin (Orx)-containing neurons are located, has been considered a waking center. Yet, melanin-concentrating hormone (MCH)-containing neurons are codistributed therein with Orx neurons and, in contrast to them, are active during sleep, not waking. In the present study employing juxtacellular recording and labeling of neurons with Neurobiotin (Nb) in naturally sleeping-waking head-fixed rats, we identified another population of intermingled sleep-active cells, which do not contain MCH (or Orx), but utilize gamma-aminobutyric acid (GABA) as a neurotransmitter. The 'sleep-max' active neurons represented 53% of Nb-labeled MCH-(and Orx) immunonegative (-) cells recorded in the LH. For identification of their neurotransmitter, Nb-labeled varicosities of the Nb-labeled/MCH- neurons were sought within sections adjacent to the Nb-labeled soma and immunostained for the vesicular transporter for GABA (VGAT) or for glutamate. A small proportion of sleep-max Nb+/MCH- neurons (19%) discharged maximally during slow-wave sleep (called 'S-max') in positive correlation with delta electroencephalogram activity, and from VGAT staining of Nb-labeled varicosities appeared to be GABAergic. The vast proportion of sleep-max Nb+/MCH- neurons (81%) discharged maximally during paradoxical sleep (PS, called 'P-max') in negative correlation with electromyogram amplitude, and from Nb-labeled varicosities also appeared to be predominantly GABAergic. Given their discharge profiles across the sleep-wake cycle, P-max together with S-max GABAergic neurons could thus serve to inhibit other neurons of the arousal systems, including local Orx neurons in the LH. They could accordingly dampen arousal with muscle tone and promote sleep, including PS with muscle atonia.


Figures

Fig. 1
Fig. 1
Immunostaining of Nb-labeled sleep-active neurons. (A) As shown in merged image (A1), an Nb-labeled cell (#c103u01) that discharged maximally during SWS, as S-max (green, arrowhead) was found intermingled with Orx+ (blue) and MCH+ (red) neurons in the LH. As also shown at higher magnification (A2, A3 and A4), the Nb+ neuron was clearly immunonegative for both Orx and MCH. (B) Found in an adjacent section, the Nb-labeled axon varicosities of the same neuron (B1, green, arrowheads, magnified in B2 and B5) were positively immunostained for VGAT (B3 and B6, red and B4 and B7, yellow in merged images). (C) Another Nb-labeled varicosity of the same neuron (C1, green, arrowhead, magnified in C2), was immunonegative for VGluT2 (C3, red and C4, in merged image). (D) As shown in merged image (D1), an Nb-labeled cell (#c102u04) that discharged maximally during PS, as P-max (green, arrowhead) was intermingled with Orx+ (blue) and MCH+ (red) neurons in the LH. As also shown at higher magnification (D2, D3 and D4), the Nb+ neuron was clearly immunonegative for both Orx and MCH. (E) Found in an adjacent section, the Nb-labeled axon varicosities of the same neuron (E1, green, arrowheads, magnified in E2 and E5) were positively immunostained for VGAT (E3 and E6, red and E4 and E7, yellow in merged images). (F) Another Nb-labeled axon varicosity of the same neuron (F1, green, arrowhead, magnified in F2) was immunonegative for VGluT2 (F3, red and F4, green in merged image). Scale bars in D1, for A1 and D1 = 40 μm; in D4 for insets A2–A4 and D2–D4 = 20 μm; in F1, for B1, C1, E1 and F1 = 5 μm; and in F4 for insets B2–B7, C2–C4, E2–E7 and F2–F4 = 2 μm.
Fig. 2
Fig. 2
Mapping of Nb-labeled (Orx− and) MCH− and VGAT+ sleep-max-active neurons in the LH. Nb-labeled sleep-max neurons were distributed in the region of Orx+ and MCH+ neurons, where Orx+ W-max neurons (Lee et al., 2005b) and MCH+ P-max neurons (Hassani et al., 2009b), were previously recorded. The Nb+/MCH− sleep-max neurons comprised S-max neurons (blue, n = 9) and P-max neurons (green, n = 39). Localization of Nb-labeled varicosities in adjacent sections for some sleep-max neurons allowed identification of (2/2) S-max MCH− neurons as VGAT+ (blue filled triangles, including the cell shown in Fig. 1A–C, depicted here as the largest blue triangle in A5.8). Similarly, localization of Nb-labeled varicosities allowed identification of (8/10) P-max MCH− neurons as VGAT+ (green filled triangles, including the cell shown in Fig. 1D–F, depicted here as the largest green filled triangle in A6.2). The remaining (2/10) P-max MCH− cells were VGAT− (green x’s). Cells were mapped according to the appropriate levels (A ~5.4, 5.8, and 6.2 mm from interaural zero) through the LH where Orx+ cells are distributed (Henny & Jones, 2006a). Abbreviations: Arc, arcuate nucleus; cp, cerebral peduncle; DMH, dorsomedial hypothalamic nucleus; f, fornix; ic, internal capsule; LH, lateral hypothalamus; mt, mammillo-thalamic tract; ot, optic tract; PH, posterior hypothalamus; STh, subthalamic nucleus; VMH, ventromedial hypothalamic nucleus; ZI, zona incerta. Scale bar, 1 mm.
Fig. 3
Fig. 3
Discharge of S-max-active MCH−/VGAT+ cell across sleep-wake states. (A) Data from Nb-labeled unit (c103u01, also shown in Fig. 1A–C) showing the sleep-wake recording scored per 10 sec epochs for sleep and wake stages along with simultaneous EEG frequency and amplitude (μV/Hz with frequency on y axis and amplitude differentially scaled according to color from blue to red, over the low frequency, 0–30 Hz from ~0–100 μV, and the high frequency, 30–60 Hz from ~0–25 μV), EMG amplitude (arbitrary units) and unit spike rate (Hz) over the recording session. Note that the unit discharged at moderately low rates during both aW (showing high EMG activity; periods indicated by red dashed vertical lines) and PS (showing low EMG activity; periods indicated by solid green vertical lines), and at its highest rates during SWS. Across stages, its discharge rate was significantly, positively correlated with delta EEG (r = 0.34). Horizontal lines (marked as 1, 2 and 3) indicate 10 sec recording epochs of aW, SWS and PS respectively shown in C. (B) Bar graph showing mean spike rate (Hz) of the unit across sleep-wake stages. Note that the unit fired at a relatively low rate during aW (7.27 Hz), increased its rate through qW, tSWS to reach its maximal rate during SWS (13.35 Hz) and decreased its rate slightly during tPS to reach a lower rate during PS (9.95 Hz). C, Polygraphic records from 10 sec epochs (indicated in A) of the unit together with EEG and EMG activity during aW (1), SWS (2) and PS (3). Note that during waking, despite an overall moderate discharge rate, the unit notably slows down its firing during active periods when EMG activity was prominent (C1). It fired continuously and tonically in single spikes during SWS (C2), with an instantaneous firing frequency of 14.9 Hz. It discharged also at moderate rates during PS (C3). Calibrations: horizontal, 1 s; vertical, 1 mV (EEG, EMG), 2 mV (unit). Abbreviations: OB, olfactory bulb; PF, prefrontal cortex; RS, retrosplenial cortex.
Fig. 4
Fig. 4
Discharge of P-max-active MCH−/VGAT+ cell across sleep-wake states. (A) Data from Nb-labeled unit (c102u04, also shown in Fig. 1D–F) showing the sleep-wake recording scored per 10 sec epochs for sleep and wake stages along with simultaneous EEG frequency and amplitude (μV/Hz with frequency on y axis and amplitude differentially scaled according to color from blue to red, over the low frequency, 0–30 Hz from ~0–100 μV, and the high frequency, 30–60 Hz from ~0–25 μV), EMG amplitude (arbitrary units) and unit spike rate (Hz) over the recording session. Note that the unit showed its lowest firing rates during aW (periods indicated by red dashed vertical lines) and high EMG activity and its highest rates during PS (periods indicated by solid green vertical lines) and low EMG activity. Across stages, its discharge rate was significantly, negatively correlated with EMG amplitude (r = −0.71). Horizontal lines (marked as 1, 2 and 3) indicate 10 sec recording epochs of aW, SWS and PS respectively shown in C. (B) Bar graph showing mean spike rate (Hz) of the unit across sleep-wake stages. Note that the unit fired at its lowest rate during aW (1.08 Hz), progressively increased its rate through qW, tSWS and SWS (1.97 Hz) and more markedly increased its rate during tPS to reach its maximal rate during PS (6.22 Hz). (C) Polygraphic records from 10 sec epochs (indicated in A) of the unit together with EEG and EMG activity during aW (1), SWS (2) and PS (3). Note that during waking, the unit fired only minimally and ceased firing altogether during active periods when EMG activity was prominent (C1). It fired periodically in one or two spikes during SWS (C2). It discharged almost continuously and at its highest rates during PS (C3) with an instantaneous firing frequency of 15.38 Hz and tendency toward irregular phasic grouping of spikes. Calibrations: horizontal, 1 s; vertical, 1 mV (EEG, EMG), 2 mV (unit). Abbreviations: OB, olfactory bulb; PF, prefrontal cortex; RS, retrosplenial cortex.
Fig. 5
Fig. 5
Discharge of sleep-max Nb+/MCH− and VGAT+ cells across sleep-wake stages. (A) As a group, all S-max Nb+/MCH− cells, including VGAT+ cells (n = 9) discharged maximally during SWS (top row). S-max VGAT+ neurons (n = 2) discharged with a similar profile (middle row). In all S-max MCH− cells, the discharge rate changed progressively in positive association with delta EEG activity across sleep-wake stages (bottom row, normalized averages from all sleep-max MCH− units). (B) As a group, the P-max Nb+/MCH− cells, including VGAT+ cells (n = 39) discharged maximally during PS (top row). P-max VGAT+ neurons (n = 8) discharged with a similar profile across sleep-wake stages (middle row). In all P-max MCH− cells, the discharge rate changed progressively across sleep-wake stages in negative association with EMG amplitude (bottom row, normalized averages from all sleep-max MCH− units).

Similar articles

Cited by

References

    1. Alam MN, Gong H, Alam T, Jaganath R, McGinty D, Szymusiak R. Sleep-waking discharge patterns of neurons recorded in the rat perifornical lateral hypothalamic area. J Physiol. 2002;538:619–631. - PMC - PubMed
    1. Alam MN, Kumar S, Bashir T, Suntsova N, Methippara MM, Szymusiak R, McGinty D. GABA-mediated control of hypocretin- but not melanin-concentrating hormone-immunoreactive neurones during sleep in rats. J Physiol. 2005;563:569–582. - PMC - PubMed
    1. Boissard R, Fort P, Gervasoni D, Barbagli B, Luppi PH. Localization of the GABAergic and non-GABAergic neurons projecting to the sublaterodorsal nucleus and potentially gating paradoxical sleep onset. Eur J Neurosci. 2003;18:1627–1639. - PubMed
    1. Broberger C, De Lecea L, Sutcliffe JG, Hokfelt T. Hypocretin/orexin- and melanin-concentrating hormone-expressing cells form distinct populations in the rodent lateral hypothalamus: relationship to the neuropeptide Y and agouti gene-related protein systems. J Comp Neurol. 1998;402:460–474. - PubMed
    1. Chaudhry FA, Reimer RJ, Bellocchio EE, Danbolt NC, Osen KK, Edwards RH, Storm-Mathisen J. The vesicular GABA transporter, VGAT, localizes to synaptic vesicles in sets of glycinergic as well as GABAergic neurons. J Neurosci. 1998;18:9733–9750. - PMC - PubMed

Publication types

MeSH terms