. 2010 Jul 2:6:17.
doi: 10.1186/1746-4811-6-17.

High-contrast three-dimensional imaging of the Arabidopsis leaf enables the analysis of cell dimensions in the epidermis and mesophyll

Affiliations

High-contrast three-dimensional imaging of the Arabidopsis leaf enables the analysis of cell dimensions in the epidermis and mesophyll

Nathalie Wuyts et al. Plant Methods. .

Abstract

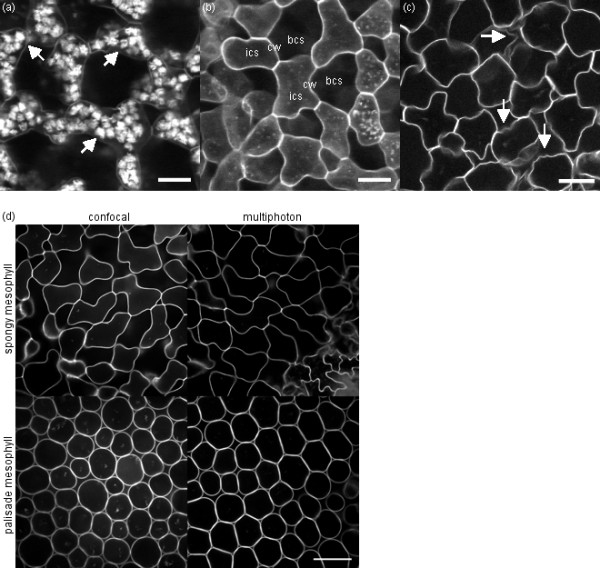
Background: Despite the wide spread application of confocal and multiphoton laser scanning microscopy in plant biology, leaf phenotype assessment still relies on two-dimensional imaging with a limited appreciation of the cells' structural context and an inherent inaccuracy of cell measurements. Here, a successful procedure for the three-dimensional imaging and analysis of plant leaves is presented.

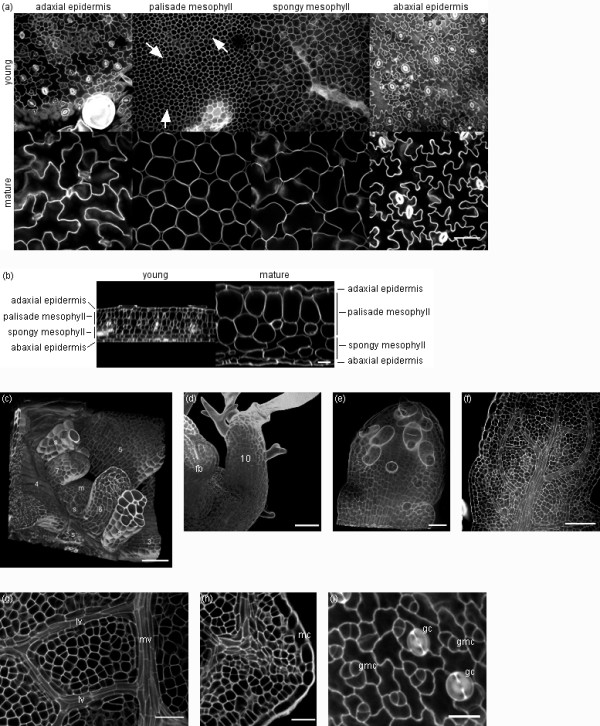
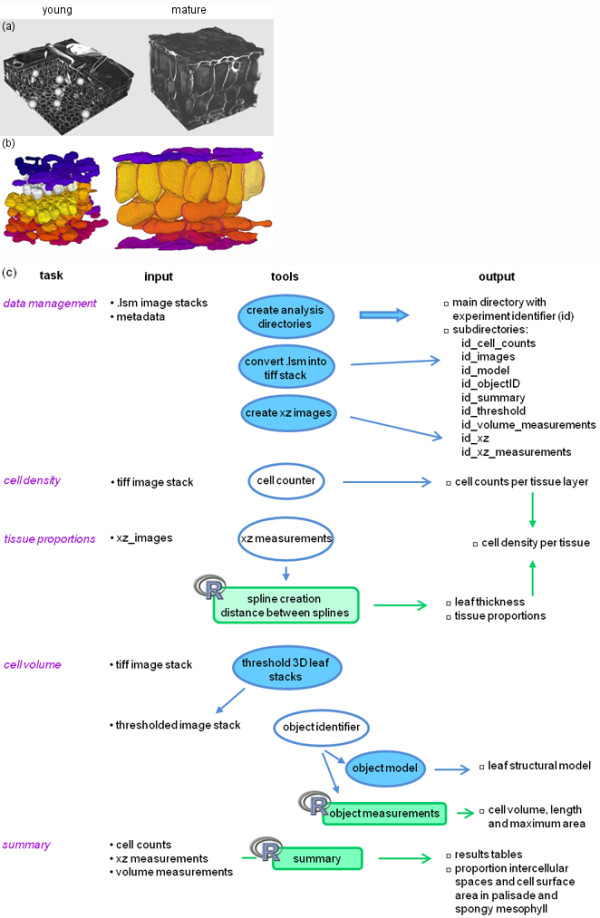
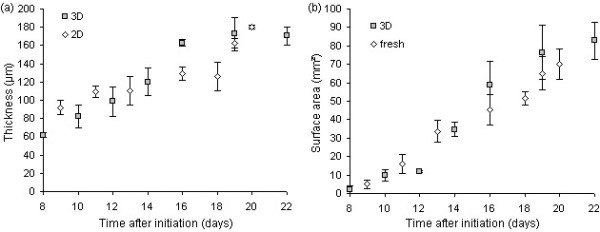
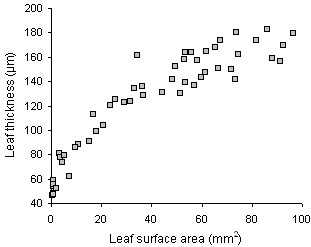
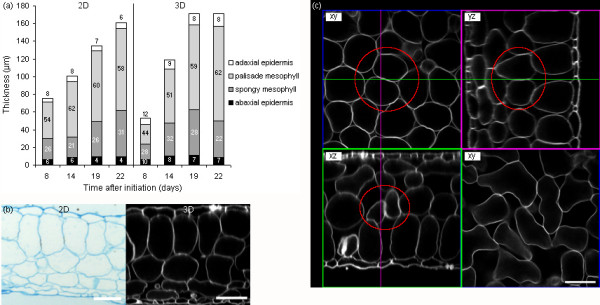
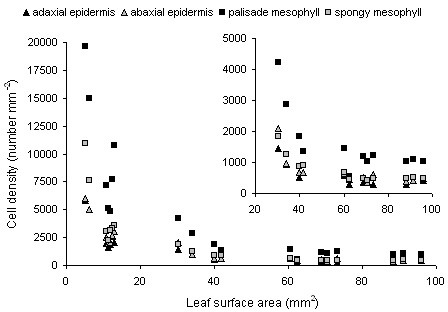
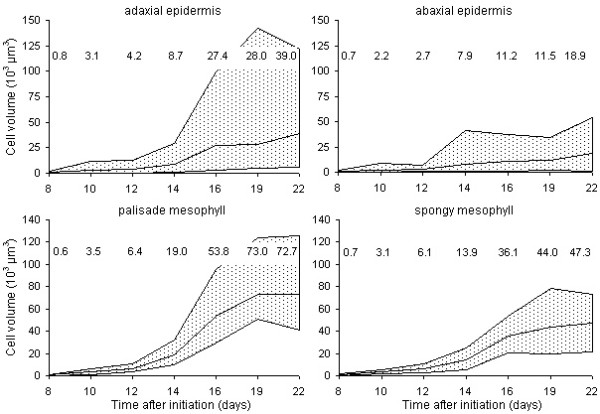
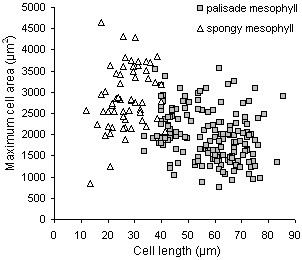
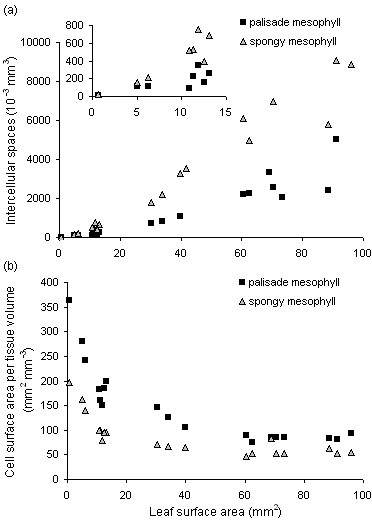
Results: The procedure was developed based on a range of developmental stages, from leaf initiation to senescence, of soil-grown Arabidopsis thaliana (L.) Heynh. Rigorous clearing of tissues, made possible by enhanced leaf permeability to clearing agents, allowed the optical sectioning of the entire leaf thickness by both confocal and multiphoton microscopy. The superior image quality, in resolution and contrast, obtained by the latter technique enabled the three-dimensional visualisation of leaf morphology at the individual cell level, cell segmentation and the construction of structural models. Image analysis macros were developed to measure leaf thickness and tissue proportions, as well as to determine for the epidermis and all layers of mesophyll tissue, cell density, volume, length and width. For mesophyll tissue, the proportion of intercellular spaces and the surface areas of cells were also estimated. The performance of the procedure was demonstrated for the expanding 6th leaf of the Arabidopsis rosette. Furthermore, it was proven to be effective for leaves of another dicotyledon, apple (Malus domestica Borkh.), which has a very different cellular organisation.

Conclusions: The pipeline for the three-dimensional imaging and analysis of plant leaves provides the means to include variables on internal tissues in leaf growth studies and the assessment of leaf phenotypes. It also allows the visualisation and quantification of alterations in leaf structure alongside changes in leaf functioning observed under environmental constraints. Data obtained using this procedure can further be integrated in leaf development and functioning models.


Figures

Figure 1
Figure 1
Leaf image problems and image quality difference between confocal and multiphoton systems. (a-c) Problems encountered upon three-dimensional imaging of leaves include: (a) starch granules (some indicated by arrows), (b) low contrast between cell walls (cw) and intracellular (ics) and intercellular spaces (bcs), and (c) wrinkling (some of it indicated by arrows) in Arabidopsis mesophyll cells (scale bars of 25 μm). (d) Single sections of an image stack of an Arabidopsis leaf (leaf 6, 16 days after initiation) acquired by confocal (left) or multiphoton (right) microscopy (scale bar of 50 μm for all images): sections in the spongy mesophyll at 35 μm in depth (top) and the palisade mesophyll at 125 μm in depth (bottom).
Figure 2
Figure 2
Three-dimensional imaging of Arabidopsis leaves at different developmental stages using multiphoton microscopy. (a) Single optical sections in, from left to right, the adaxial epidermis, the palisade mesophyll, the spongy mesophyll and the abaxial epidermis, taken from an image stack of a young leaf (leaf 6, 8 days after initiation, top row) and a mature leaf (leaf 6, 19 days after initiation, bottom row) (scale bar of 50 μm for all images at bottom right). Cell division planes are indicated by arrows. (b) Orthogonal views (xz) of the same image stacks: young leaf (left) and mature leaf (right) (scale bar of 25 μm for both images). (c-f) Three-dimensional imaging of leaves before emergence: (c) meristem (m) and leaves 3-7 with stipules (s) (12 days after sowing, scale bar of 20 μm), (d) leaf 10 and floral bud (fb) (18 days after sowing, scale bar of 20 μm), (e) leaf 9 (20 days after sowing, scale bar of 10 μm), (f) leaf 8 (20 days after sowing, scale bar of 50 μm). (g) Vein development in a young leaf (leaf 6, 11 days after initiation, mv-midvein, lv-lateral vein, scale bar of 25 μm). (h) Leaf serration in a young leaf (leaf 6, 7 days after initiation, mc-marginal cells, scale bar of 20 μm). (i) Guard cell development in a young leaf (leaf 6, 11 days after initiation, gc-guard cell, gmc-guard mother cell, scale bar of 15 μm).
Figure 3
Figure 3
Three-dimensional visualisation and image analysis. (a) Three-dimensional visualisation in the MedINRIA ImageViewer software of a young (leaf 6, 8 days after initiation, left) and a mature Arabidopsis leaf (leaf 6, 19 days after initiation, right). (b) Three-dimensional structural model of a young (leaf 6, 10 days after initiation, left) and a mature Arabidopsis leaf (leaf 6, 22 days after initiation, right). (c) Image analysis flow diagram: ImageJ macros are indicated in blue (blue background-fully automated, white background-semi-automated) and R scripts in green.
Figure 4
Figure 4
Thickness and surface area of expanding leaves measured by different techniques. (a) Thickness (average ± standard deviation) measured in the middle of leaf 6 of the Arabidopsis rosette on transversal views obtained by histological sectioning (2D) or three-dimensional imaging (3D). (b) Surface area (average ± standard deviation) of leaf 6 of the Arabidopsis rosette measured on scans of fresh leaves (fresh) or after three-dimensional imaging (3D).
Figure 5
Figure 5
Leaf expansion in surface area and thickness. Scatter plot of thickness versus surface area of individual leaves (leaf 6 of the Arabidopsis rosette) between 8 and 22 days after leaf initiation.
Figure 6
Figure 6
Leaf tissue expansion measured on two- and three-dimensional images. (a) Thickness and proportions of leaf thickness (average %, indicated inside bars) occupied by, from top to bottom, the adaxial epidermis, the palisade mesophyll, the spongy mesophyll and the abaxial epidermis, in the middle of leaf 6 of the Arabidopsis rosette as measured by histological sectioning (2D, left) and three-dimensional imaging (3D, right). (b) Transversal (xz) views of leaf 6 of the Arabidopsis rosette (19 days after initiation) obtained by histological sectioning (2D, left) and three-dimensional imaging (3D, right, scale bar of 50 μm for both images). (c) Paradermal (xy) and transversal (xz, yz) views of a leaf image stack illustrating the difficulty in the assessment of palisade and spongy mesophyll cell identity using transversal views only. The palisade mesophyll cells encircled in red could easily be mistaken for spongy mesophyll cells based on the xz-view only (bottom left). Their identity is clear in the xy-(top left) and yz-views (top right). True spongy mesophyll cells are shown for a comparison of cell shapes (xy, bottom right, scale bar of 50 μm).
Figure 7
Figure 7
Cell density determined for both epidermal and mesophyll tissues. Scatter plot of cell density versus leaf surface area of individual leaves (leaf 6 of the Arabidopsis rosette, between 8 and 22 days after leaf initiation) as determined for the adaxial and abaxial epidermis, and the palisade and spongy mesophyll. The inset is a zoom on the dataset and shows cell densities for leaf surface areas between 20 and 100 mm2.
Figure 8
Figure 8
Cell volumes measured in both epidermal and mesophyll tissues. Range of cell volumes observed during expansion in the adaxial epidermis (top left), the abaxial epidermis (top right), the palisade mesophyll (bottom left) and the spongy mesophyll (bottom right) of leaf 6 of the Arabidopsis rosette. The graphs represent the minimum and maximum cell volume measured; the lines in the middle of the graphs indicate the average cell volume. Its value is shown for the different time points (days after initiation of leaf 6).
Figure 9
Figure 9
Length and area of mesophyll cells in fully expanded leaves. Scatter plot of cell length versus maximum cell area of individual cells in the palisade and spongy mesophyll of leaf 6 of the Arabidopsis rosette at the end of leaf surface area expansion (19-22 days after initiation).
Figure 10
Figure 10
Intercellular spaces and cell surface area in the palisade and spongy mesophyll. Scatter plot of the volume of intercellular spaces (a) and cell surface area per tissue volume (b) versus leaf surface area in the palisade and spongy mesophyll of individual leaves (leaf 6 of the Arabidopsis rosette, between 8 and 22 days after leaf initiation). The inset in (a) is a zoom on the dataset and shows the volume of intercellular spaces for leaf surface areas between 0.5 and 15 mm2.

References

    1. Pyke KA, Marrison JL, Leech RM. Temporal and spatial development of the cells of the expanding first leaf of Arabidopsis thaliana (L.) Heynh. J Exp Bot. 1991;42:1407–1416. doi: 10.1093/jxb/42.11.1407. - DOI
    1. Tsukaya H. Controlling size in multicellular organs: focus on the leaf. PLoS Biol. 2008;6:e174. doi: 10.1371/journal.pbio.0060174. - DOI - PMC - PubMed
    1. Granier C, Tardieu F. Multi-scale phenotyping of leaf expansion in response to environmental changes: the whole is more than the sum of parts. Plant Cell Env. 2009;32:1175–1184. doi: 10.1111/j.1365-3040.2009.01955.x. - DOI - PubMed
    1. Dengler NG. Comparative histological basis of sun and shade leaf dimorphism in Helianthus annuus. Can J Bot. 1980;58:717–730.
    1. Schurr U, Heckenberger U, Herdel K, Walter A, Feil R. Leaf development in Ricinus communis during drought stress: dynamics of growth processes, of cellular structure and of sink-source transition. J Exp Bot. 2000;51:1515–1529. doi: 10.1093/jexbot/51.350.1515. - DOI - PubMed

LinkOut - more resources