. 2010 Aug 10;20(15):1362-7.
doi: 10.1016/j.cub.2010.06.015. Epub 2010 Jul 1.

Visual sensitivity underlying changes in visual consciousness

Affiliations

Visual sensitivity underlying changes in visual consciousness

David Alais et al. Curr Biol. .

Abstract

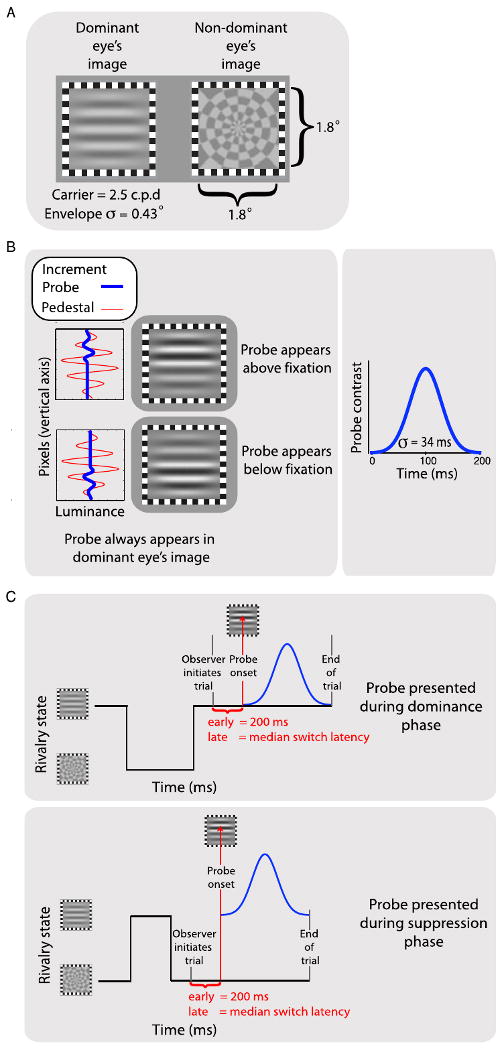
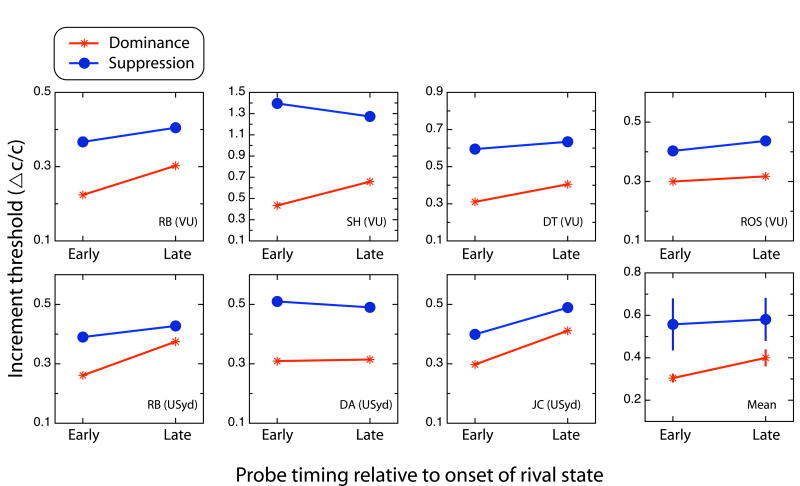
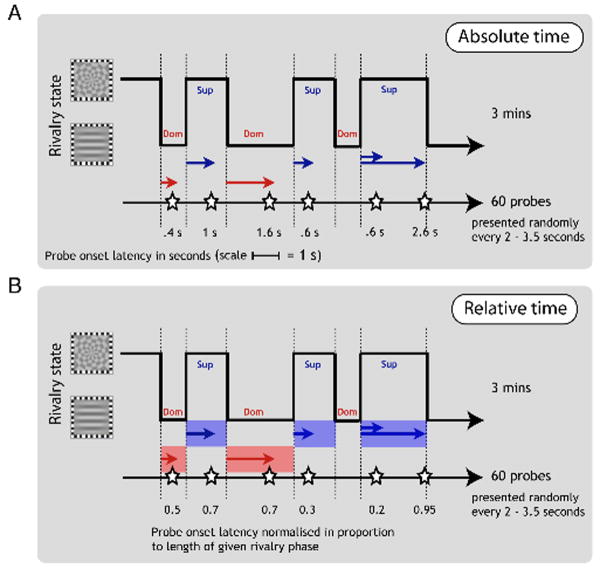
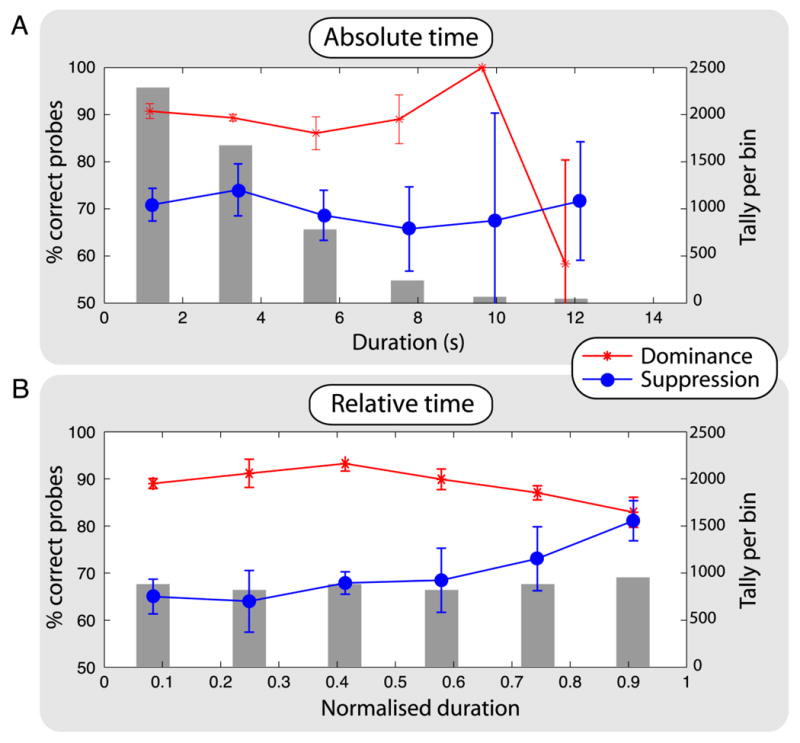
When viewing a different stimulus with each eye, we experience the remarkable phenomenon of binocular rivalry: alternations in consciousness between the stimuli [1, 2]. According to a popular theory first proposed in 1901, neurons encoding the two stimuli engage in reciprocal inhibition [3-8] so that those processing one stimulus inhibit those processing the other, yielding consciousness of one dominant stimulus at any moment and suppressing the other. Also according to the theory, neurons encoding the dominant stimulus adapt, weakening their activity and the inhibition they can exert, whereas neurons encoding the suppressed stimulus recover from adaptation until the balance of activity reverses, triggering an alternation in consciousness. Despite its popularity, this theory has one glaring inconsistency with data: during an episode of suppression, visual sensitivity to brief probe stimuli in the dominant eye should decrease over time and should increase in the suppressed eye, yet sensitivity appears to be constant [9, 10]. Using more appropriate probe stimuli (experiment 1) in conjunction with a new method (experiment 2), we found that sensitivities in dominance and suppression do show the predicted complementary changes.


Figures

Figure 1
Figure 1
(A) Illustrations of the rival targets used in Experiments 1 and 2. The observer's rivalry-dominant eye always received the grating. (B) The two panels in the left-hand column plot the luminance profiles of the grating (red curve; pedestal) and the probe (blue curve). The probes were contrast increments added to the upper or lower half of the grating (illustrated in the right-hand column), with the magnitude of the contrast increment varied adaptively to find the contrast increment threshold. The probe contrast increment was added smoothly over time with a Gaussian profile (right-hand plot). (C) In Experiment 1, a series of short trials was used. Observers waited for rivalry to stabilise, then pressed a key to show the probe once the desired state was achieved (dominance or suppression, depending on condition). A brief period elapsed, either 200 ms for early probes or the median dominance duration for late probes (approximately 3 seconds), after which the probe contrast increment was presented. The trial terminated after the probe and the screen went blank. When the rivalry state changed prior to the onset of the probe, observers released the key, leading to the trial's being aborted.
Figure 2
Figure 2
Results from Experiment 1. Contrast increment thresholds (ΔC/C: the contrast value necessary to detect an increment divided by the contrast of the background grating against which the increment appeared) for probe detection as a function of probe latency, for dominance and suppression states. Each point is the mean of at least four staircases. Data from all six observers are shown, including RB's data from two sites, together with the overall mean (bottom right panel) and standard errors of those means. On average, dominance thresholds are higher for late probes (i.e., sensitivity is lower), although suppression thresholds tend to remain stable.
Figure 3
Figure 3
Methods for Experiment 2. Observers continuously tracked their rivalry alternations while 60 contrast-increment probes were delivered at irregular intervals to the grating viewed by one eye. We then used the tracking sequence to divide the probes into dominance and suppression phases and to determine the timing of a given probe from the onset of the current rivalry phase. Probe timing could be coded as absolute time (A), or as relative time (B).
Figure 4
Figure 4
Results from Experiment 2. (A) The data points and lines show group means with standard error of those means for probe-detection performance (left-hand y-axis) for each rivalry state, as a function of time after onset of that state (advanced by 450 ms to correct for observers' latency in responding to perceptual changes, although any value from 400 to 650 ms produces similar results) plotted on the x axis. We sorted times into six equal-width bins for dominance and for suppression (the range of times for dominance was slightly smaller than that for suppression). The grey bars show the number of observations in each time bin (right-hand y-axis), summed over dominance and suppression with all observers pooled. Performance is better for dominance (red trace) than for suppression (blue trace), and there is no clear change in relative performance as a function of time. The grey bars show the typical gamma-shaped distribution of dominance times, explaining why probe performance data become so noisy in the last two time bins: there are very few observations in them. (B) The data from panel A recoded as relative time by normalising to the maximum time of each episode of rivalry. Normalising the state durations equalises the number of probes in each bin and reveals a clear change in relative performance over time. In the later time bins, dominance performance drops and suppression performance increases, consistent with the effects of adaptation on reciprocal inhibition.

Comment in

Similar articles

Cited by

References

    1. Wheatstone C. Contributions to the physiology of vision.—Part the First. On some remarkable, and hitherto unobserved, phænomena of binocular vision. Philosophical Transactions of the Royal Society of London. 1838;128:371–394.
    1. Breese BB. On inhibition. Psychological Monographs. 1899;3:1–65.
    1. McDougall W. IV.—Some new observations in support of Thomas Young's theory of light- and colour-vision (I.) Mind. 1901;10:52–97.
    1. Sherrington CS. The integrative action of the nervous system. London: Constable; 1906.
    1. Sugie N. Neural models of brightness perception and retinal rivalry in binocular vision. Biological Cybernetics. 1982;43:13–21. - PubMed

Publication types

LinkOut - more resources