

Age-related differences in lower-limb muscle cross-sectional area and torque production in boys with Duchenne muscular dystrophy
- PMID: 20599043
- PMCID: PMC5961721
- DOI: 10.1016/j.apmr.2010.03.024
Age-related differences in lower-limb muscle cross-sectional area and torque production in boys with Duchenne muscular dystrophy
Abstract
Objective: To examine the relationship between lower-extremity muscle cross-sectional area, muscle strength, specific torque, and age in ambulatory boys with Duchenne muscular dystrophy (DMD) compared with controls.
Design: Observational cross-sectional study.
Setting: University research setting.
Participants: Volunteer sample of boys with DMD (n=22) and healthy control boys (n=10), ages 5 through 14 years.
Interventions: Not applicable.
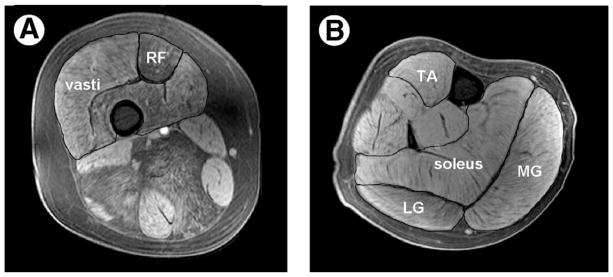
Main outcome measures: Maximal muscle cross-sectional area (CSA(max)) assessed by magnetic resonance imaging of quadriceps, plantarflexors (PFs) and dorsiflexors (DFs), peak isometric torque from dynamometry, and timed functional tests.
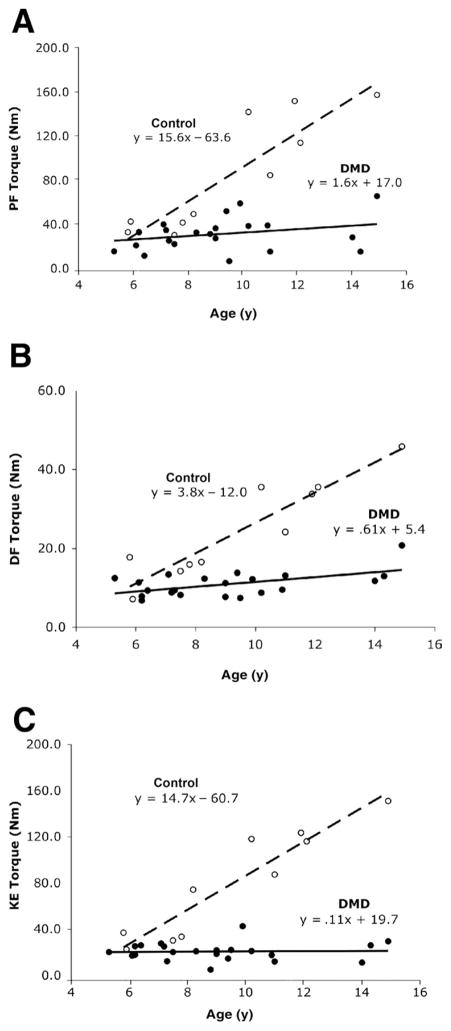
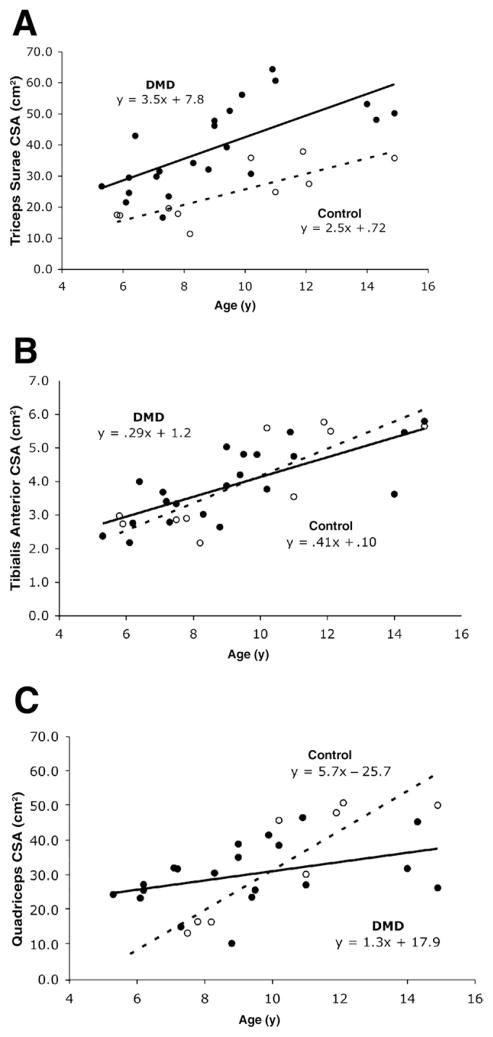
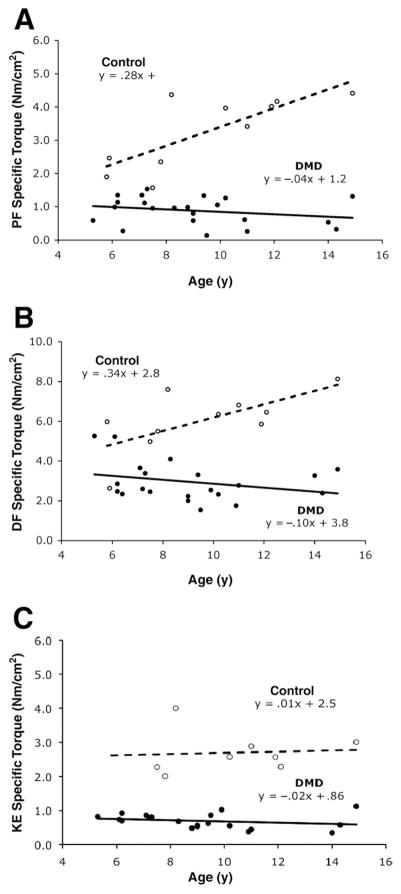
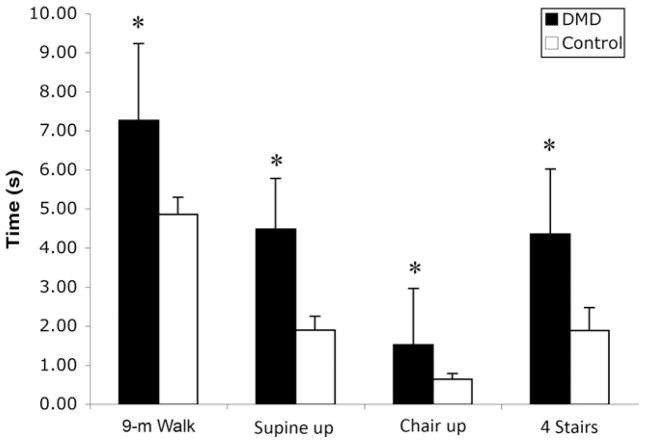
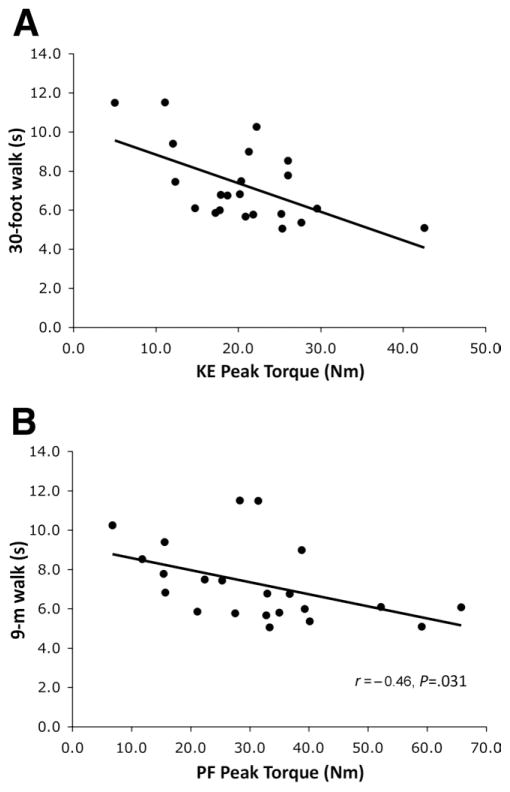
Results: The average CSA(max) of the triceps surae muscle group was approximately 60% higher in boys with DMD compared with controls (39.1+/-13.6 cm(2) vs 24.5+/-9.3 cm(2); P=.002), while the tibialis anterior muscle showed age-appropriate increases in CSA(max). The increase in quadriceps CSA(max) was also distinctly different in boys with DMD compared with controls. Specific torque (ie, peak torque/CSA(max)) was impaired in all 3 muscles groups, with the knee extensor (KE) and PF muscles showing 4-fold, and the DF muscles 2-fold, higher values in controls compared with boys with DMD. Large age-related gains in specific torque were observed in all 3 muscle groups of control subjects, which were absent in ambulatory boys with DMD. Correlations were observed between performance on functional tasks and quadriceps and PF torque production (r=-.45 to -.57, P<.05), but not with DF strength.
Conclusions: Age-related changes in muscle cross-sectional area and specific torque production in lower-extremity muscles showed distinctly different patterns in the KE, PF, and DF muscles of boys with DMD compared with controls.
Copyright 2010 American Congress of Rehabilitation Medicine. Published by Elsevier Inc. All rights reserved.
Conflict of interest statement
No commercial party having a direct financial interest in the results of the research supporting this article has or will confer a benefit on the authors or on any organization with which the authors are associated.
Figures
References
-
- Emery AE. Population frequencies of inherited neuromuscular diseases–a world survey. Neuromuscul Disord. 1991;1:19–29. - PubMed
-
- Deconinck N, Dan B. Pathophysiology of duchenne muscular dystrophy. Pediatric Neurology. 2007;36:1–7. - PubMed
-
- Sussman M. Duchenne muscular dystrophy. J Amer Acad Orthop Surg. 2002;10:138–51. - PubMed
-
- Marden FA, Connolly AM, Siegel MJ, Rubin DA. Compositional analysis of muscle in boys with Duchenne muscular dystrophy using MR imaging. Skeletal Radiol. 2005;34:140–8. - PubMed
Publication types
MeSH terms
Grants and funding
LinkOut - more resources
Full Text Sources
Miscellaneous
